


IntEractions between hydrodyNamics and bioTic communities in fluvial Ecosystems: advancement in the knowledge and undeRstanding of PRocesses and ecosystem sustainability by the development of novel technologieS with fIeld monitoriNg and laboratory testing
PRIN Project (PROGETTI DI RICERCA DI RPRIN Project (PROGETTI DI RICERCA DI RILEVANTE INTERESSE NAZIONALE – Bando 2017 Prot. 2017SEB7Z8) funded by the Ministry of Education, University and Research (MIUR) of Italy
Period
November 2019 – November 2022 (36 months) – extended to March 2023
Partners
The consortium is leaded by CNR with the collaboration of other 4 partners:
- University of Perugia;
- University of Palermo;
- University of Trento;
- University of Padova.
Project overview
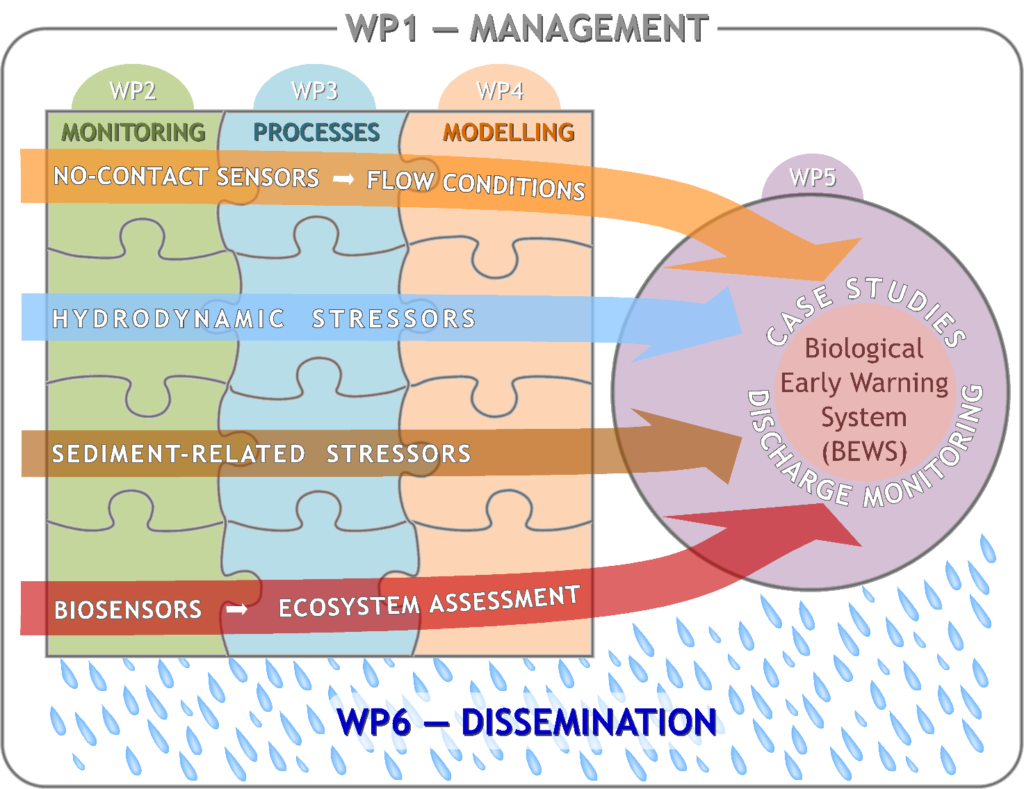
The overall objective of the project is the development of advanced technologies and innovative methods that, using radar, biological sensors, hydrodynamic models and algorithms, allow, for the first time, to predict the river flows also during high floods as well as the impact of hydrodynamic processes on the river biotic communities.
The project aims to face a twofold challenge, the first is that raised by World Meteorological Organization to identify advanced techniques for discharge monitoring at high flow, of interest to control extreme events and the second challenge is that of the European Biodiversity Strategy to 2020 (European Commission, 2011) for a better protection of ecosystems along with the contribution to averting global biodiversity loss. The basic idea of the project comes from recent studies conducted by involved Research Units that have highlighted how the integrated use of advanced technology and a refined eco-hydraulic modeling can lead to new insights on discharge monitoring and ecosystem-river processes. To achieve the target, ENTERPRISING is articulated in different levels of activity synergistically connected and concern:flows also during high floods as well as the impact of hydrodynamic processes on the river biotic communities.
- the monitoring of river flow by developing innovative no-contact technology;
- the identification and modeling of interaction mechanisms between hydrodynamics processes and biotic communities;
- the development of advanced technologies for monitoring the response of biotic communities to hydro-morphological changes with the testing in laboratory and field;
- 4) the evaluation of the effects of hydrodynamic processes on river ecosystem communities in different environments as a base for the development of an effective Biological Early Warning System (BEWS).
ENTERPRISING will contribute in improving the scientific and non-contact technological capabilities for a continuous, effective and accurate monitoring of surface velocity and water level by developing and testing an innovative multi-function lightweight radar sensor, able to operate in a wide variety of conditions such as during extreme events, at night, or on-board of drones so as to allow monitoring inaccessible sites too. A prototype of radar-drone system will be tested in different river contexts. The surface velocity and water level measurements provided by the developed radar will feed a hydrodynamic, entropy-based model able to characterize the main turbulence structures of flow along with the intensity of associated sediment transport, also in presence of secondary currents and vegetation. Considering that the entropy-based model is a 2D site-based approach, a high-resolution 3D numerical modelling will be also developed to refine the entropy-based velocity distribution mainly in the representation of turbulence structures close to the side-walls. The relevant hydrodynamic processes will be identified in flow domains also affected by bed-forms and grain textures, such as step and pools, riffle or dunes. A detailed determination of zones of high or small entraining stresses around the grains of the bed, will help to understand the dynamic of sediment transport. This analysis is meant to identify the hydraulic stressors for biotic ecosystems. Case Studies in field and laboratory will be used for the study.
Activities
Planned Activities
ENTERPRISING is articulated in different activities synergistically connected and concern:
- monitoring of river flow by innovative no-contact technologies;
- identification and modeling of interaction mechanisms between hydrodynamics processes and biotic communities;
- development of advanced technologies for monitoring the response of biotic communities to hydro-morphological changes with testing in laboratory and field;
- evaluation of the effects of hydrodynamic processes on river ecosystem communities in different environments, as a base for the development of a Biological Early Warning Systems
- dissemination
WP1 – Project Set Up and Management
Project Set-up. WP aims to develop a detailed and coherent project strategy to achieve all the identified objectives. The kick-off meeting will be organized so that the project needs are well communicated and picked-up by all partners.
Project Management. Preparation of all necessary actions for project implementation and monitoring and reporting the progress of the whole project in the framework of the agreed monitoring system.
Preparation of partner meetings, meeting direction, circulation of working documents among partners, progress and financial follow up and reporting, adjustment actions, participation in thematic networks and financial management of the project
WP2 – Monitoring
Task 2.1
The implementation of no-contact sensors for river monitoring using radar and optical technologies.
a.1) The 24-GHz Doppler radar sensor, developed in last years by UNIPG, [Technology Readiness Level (TRL)=5], has already validated in terms of surface flow velocity measurements. UniPG will work so that the sensor (top Fig3) can be:
- modified according to the FMCW-Doppler architecture for application also onboard drone, removing the propeller disturbances and fixing the payload and power supply;
- further miniaturized by a single-chip solution; and
- equipped with a 24-GHz electronic scanning antenna (TRL=3) with a tailored acquisition datalogger.
a.2) The drone will be provided by CNR (Phantom4), whose UAV position accuracy is guaranteed by a low-cost GPS RTK solution.
a.3) UNIPA will set-up optical sensors and the images processing for detecting surface velocity maps. Tests will be performed in laboratory by UniPG and UniPA and in gauged river sites by UNIPG and CNR. UniPG is in charge of Task.
Task 2.2
To develop and applying techniques for the measurement/evaluation of the sediment transport.
b.1) Apply adequate techniques in field (colored or PIT tracers, volumetric traps, turbidimetry) (UniTN)
b.2) Apply laboratory tools (laser stripe, stereoscopic images) will be shared with UniPA and CNR, to evaluating the mechanical aspects of sediment transport and associate them to the biological issues.
b.3) Analyze the response of biotic community to hydraulic stressors by experiments in UniPA’s laboratory. The response of three Italian species of mussels, selected by CNR and characterized by different habitat requirements, will be tested as sentinels through high resolution real-time valvometric measures. Mussels will be monitored in cages and acclimated to the canals under slow water current before starting the exposure experiment.
b.4) Investigate the interactions between hydrodynamics and key target species by varying the flow discharge, the vegetation and the sediment transport.
b.5) Focus on the development of a valvometric Biological Early Warning System (BEWS) based on the behavioral response in terms of valve movements of the three sentinel mussels species.
WP3 – Processes
WP is articulated in three tasks addressing, respectively, the analysis of radar sensor frequencies, the understanding of hydrodynamic processes and the response of biotic community to hydraulic stressors
Task 3.1
A study on the multi-frequency radar back-scattering from the water surface will be carried-out by UniPG in order to identify and quantitatively model the main mechanisms (interface effects, ripples effects, etc.) leading to surface velocity distribution. The study will be based on theoretical models, electromagnetic simulations and field campaigns with CNR unit.
Task 3.2
a1) Based on experimental data collected in laboratory and field, CNR and UniPA will investigate the two-dimensional flow velocity distribution starting from the surface-velocity measures for different flow conditions and planimetric channel configurations. The presence of secondary currents will be also analyzed.
a2) UniTN with CNR and UniPA will investigate the potential entropy constraint linking sediment transport (bedload, suspension), discharges and flow section shape and area, to local variables measured by no-contact sensors.
Task 3.3
CNR will evaluate the feasibility of a Biological Early Warning System (BEWS), to estimate the changes in hydraulic parameters that may impact on ecosystem communities. To this end, information on velocity profiles and secondary circulation processes provided by UniPA and CNR along with on sediment-transport indications provided by UniTN will be used to verify the cause-response relationship between hydrological and behavioral changes and to define thresholds of detection of hydrological disturbance.
Once defined the eligibility of BEWS, the experimental data collected in laboratory and field conditions will be used to come up with the BEWS system under a wide range of hydrodynamic conditions.
WP4 – Modeling
WP has four tasks concerning the development of models for: radar backscattering, turbulent structures with sediment transport also using a refined 3D model, and biotic response to river regimes changes
Task 4.1
UniPG will deal with the processing algorithms to turn raw radar signals into surface velocity and water level data. According to the FMCW-Doppler radar architecture the algorithms will be based on Fast Fourier Transforms, signal estimation and machine learning approaches. In addition, spectrograms should be constructed to relate the obtained ranges and velocities to the antenna pointing direction, as the scanning antenna is pointing different directions for different carrier frequencies.
Task 4.2
CNR with UniPA will refine the entropy-based methodology proposed by Moramarco et al. [32], which allows to predict 2D velocity distribution and to detect information on secondary currents from the surface-velocity distributions.
UniTN will be engaged with CNR and UniPA to extend and generalize to sediment-laden flows the recent and novel assessment of the existence of entropy rules that relate macro and local hydrodynamic quantities pertaining riverine flow section.
Task 4.3
UniPD unit will closely collaborate with UniTN and UniPA in the analysis of 3D numerical results on flow dynamics over macro-roughness or bed-forms. The aims is to detect the flow processes, associated to the presence of bed forms, that affect the entrainment and motion of grains over a macro-rough bed.
UniPD unit will implement 3D high-resolution numerical models, based on the Large Eddy Simulation technique, to improving the representation of the near-wall flow field. Model parameterizations will be based on CAL/VAL by data collected in laboratory and field.
Task 4.4
- identify the rivers hydro-morphological changes that may impact biota;
- define threshold limits for a sustainable use of water resources. The interactions between flow characteristics and biotic components will be analyzed by CNR and UniPA and the responses of the biotic (animal and vegetal) key target species will be related to the hydro-mophodynamic parameters.
- Based on 3D analysis, UniPD and CNR will collaborate to identifying the local key hydrodynamic processes that may affect the behavioral response of mussels, along with a functional relationship between descriptors of hydrodynamic flow field and impacts on ecosystem biota.
WP5 – Case Study
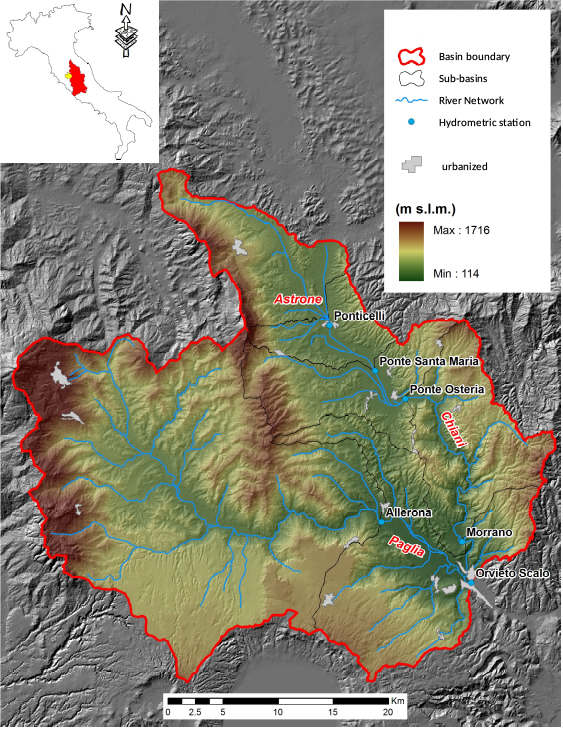
- A prolonged monitoring of the biotic behavior in a fluvial system will be performed at Ponte Adunata (1200 km2) on Paglia River, a tributary of Tiber River, subjected to flooding and high sediment transport. Data on water level, surface velocity are available at sub-hourly time resolution.
- The drone prototype will be tested to monitor the discharge during high floods. (Resp: UNIPG),
- Based on data collected at Ponte Adunata and in laboratory (Resp: UNIPA), the mussel cages will be installed for short terms (a few weeks) in further sites, opportunely selected along rivers Avisio or Fersina (eastern Alps), San Bernardino (western Alps), and Patrì (Sicily), in order to represent the impact of various hydro-morphological features and to make the whole dataset more complete.
WP6 – Dissemination
WP aims to develop a robust dissemination strategy of a reliable discharge monitoring by no-contact sensors also for high floods, and specific interventions for an efficient detecting ecosystem impacts by BEWS.
Moreover, CNR unit will design a Website platform, from the beginning of the project, to provide access to all partners and end-users on the project’s information.
Stakeholders will be involved in the whole project process and scientific publications are also planned. CNR is in charge.
Developed Activities
Laboratory
1. ANALYSIS OF HYDRODYNAMICS FLOW FIELD OVER A GRAVEL BED
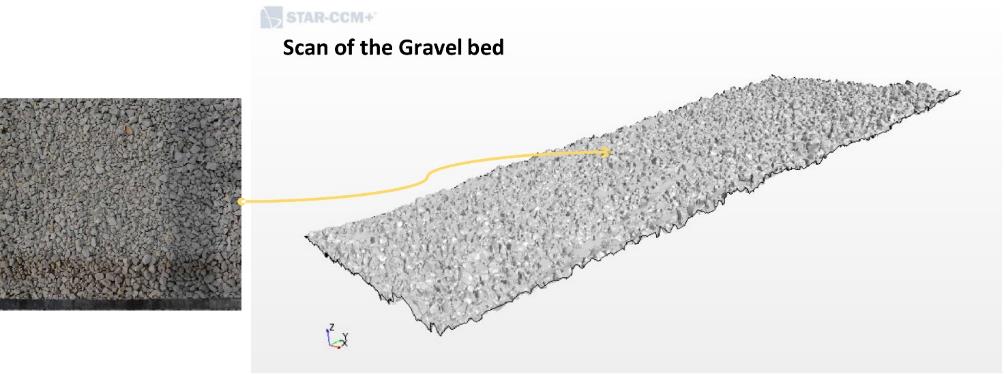
In this part of the project, the main goal is assessing the interaction between the turbulent flow field generated by a rough bed, the wakes produced by fresh-water mussels partially buried in the bed, and the physical parameters that affect mussel life, such as destabilizing drag forces and the hydrodynamic transport of nutrients/pollutants, which are essential to their survival. This is achieved by simulating the hydrodynamic flow field over a gravel bed numerically, with one or more mussels partially buried in the bed. The CFD software STAR-CCM+ (from Siemens Simcenter) is used to perform eddy‐resolving simulations using the Detached Eddy Simulation (DES) approach.
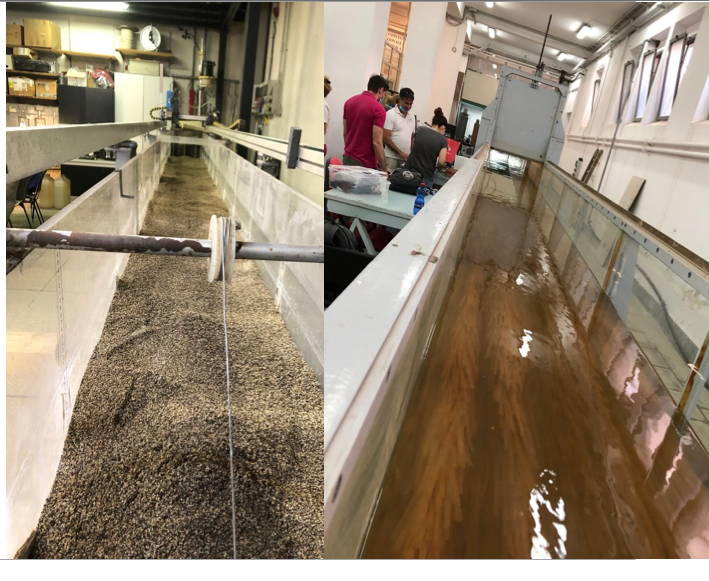
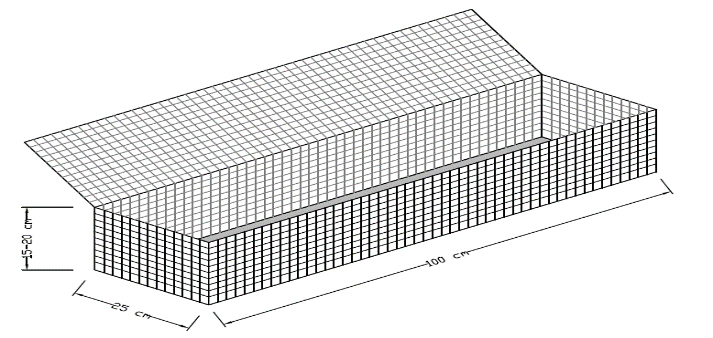
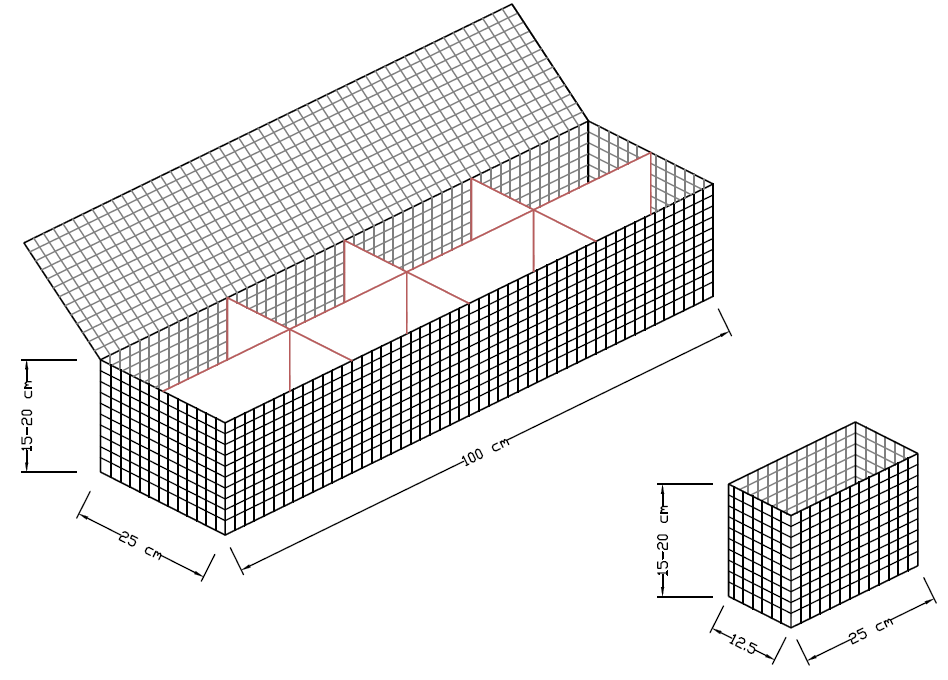
To achieve a robust model validation, ad-hoc laboratory data were collected at the Laboratory of Palermo University. A 40 cm wide flume was paved with small gravels to obtain an irregular rough bed (Figure 1, left). A high-resolution 3D digital terrain model obtained through stereo-photogrammetry scan (1.200.000 triangular elements) was imported in the CFD software (Figure 1, right) and used to setup a 3D computational grid (Figure 2).
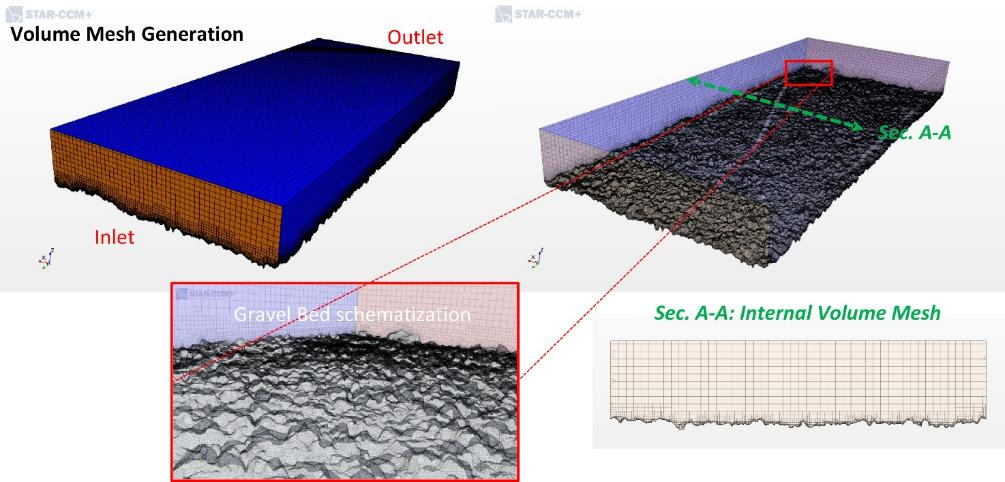
A fresh-water mussel was scanned as well. Its 3D digital model was imported in STAR‐CCM+ and properly located in the rough bed to produce a volume mesh with the mussel partially buried within the gravel bed (Figure 3).
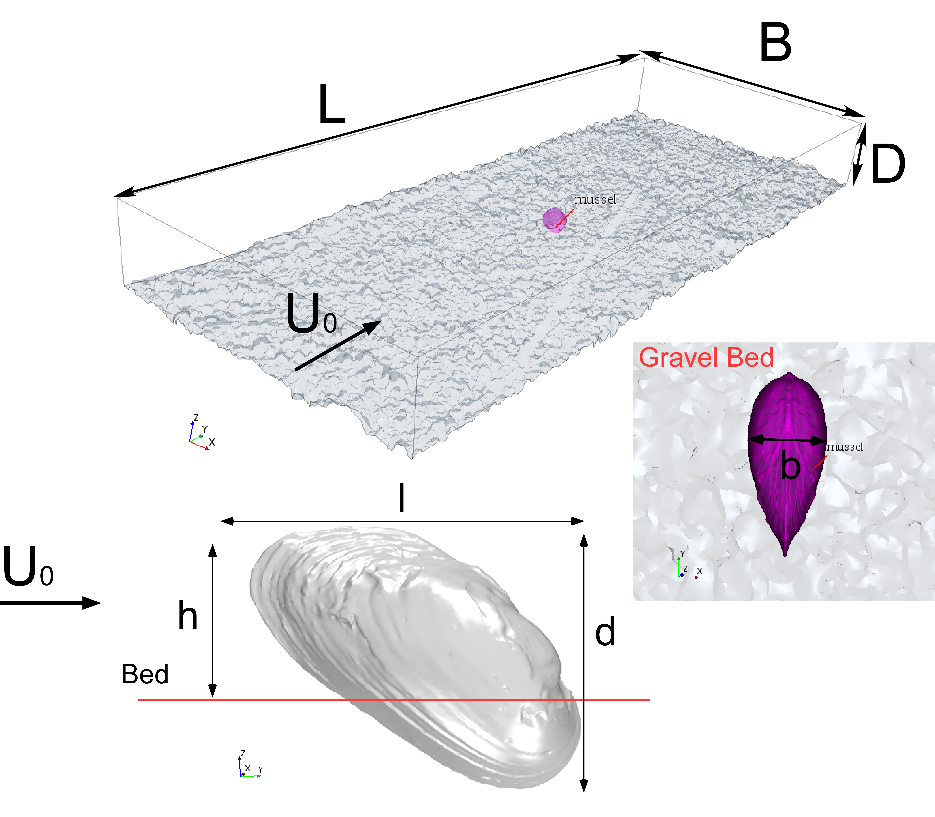
To obtain a high-quality computational grid, needed to resolve the boundary layer properly, specific criteria need to be met as for the spatial resolution near boundaries (flume walls, rough bed elements, and mussel surface). A progressive coarsening then allows limiting the number of total computational cells (Figure 4). Preliminary results are shown, for demonstrative purposes, in terms of water velocity, pressure, and wall shear stress (Figures 5-7).
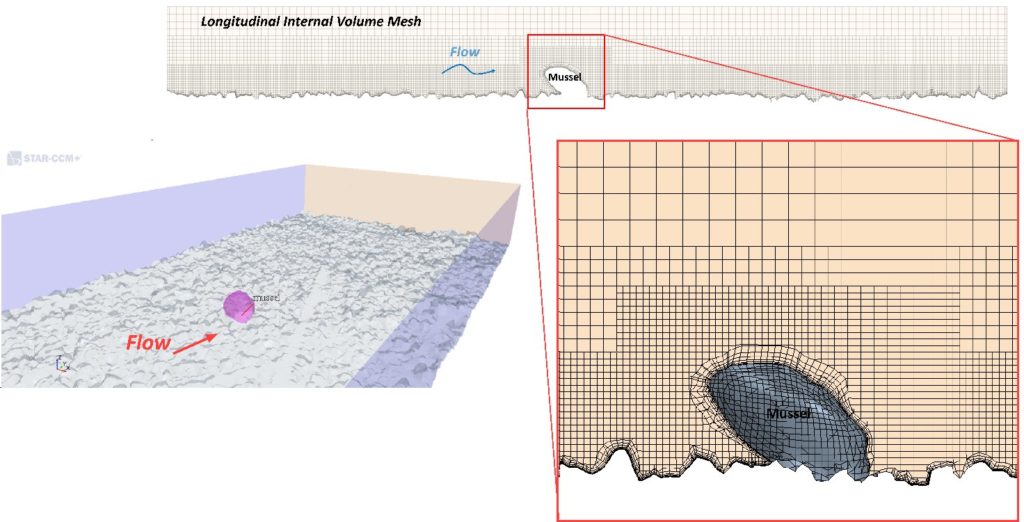
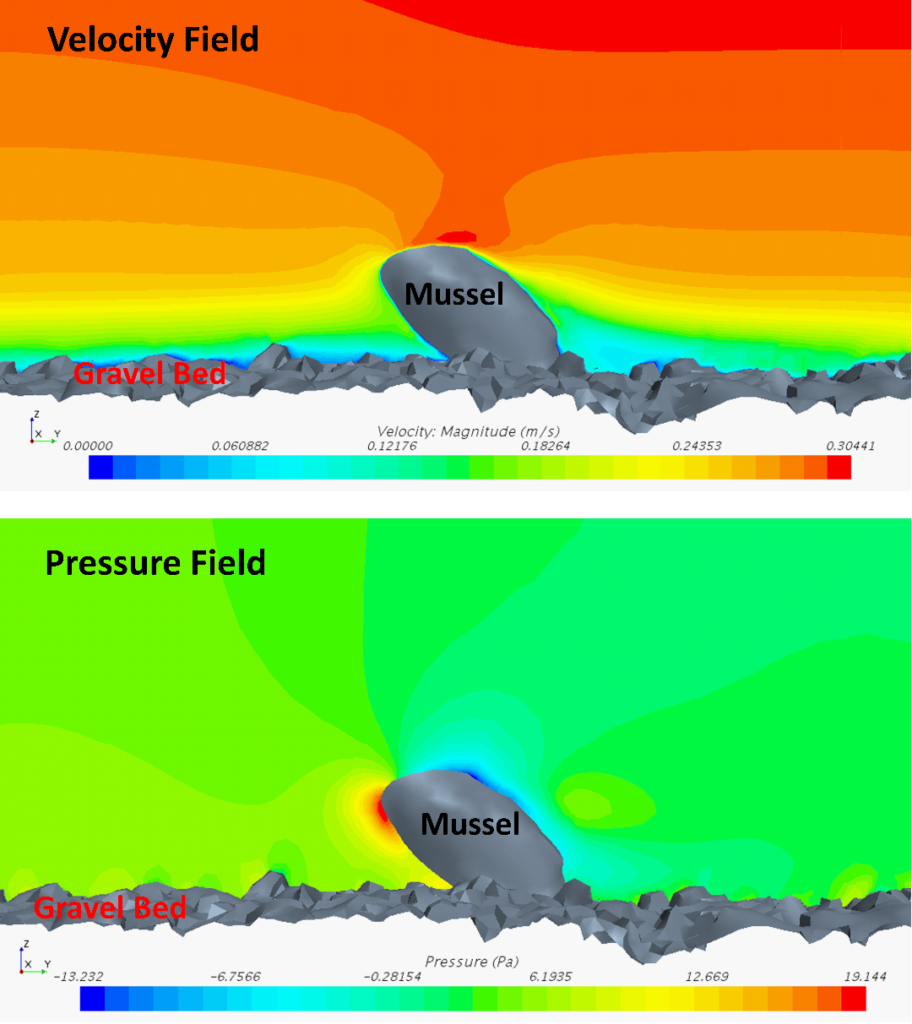
Figure 5. Preliminary results: Instantaneous velocity (top) and pressure (bottom) along the longitudinal direction around the mussel. These quantities are measured in the vertical plane cuts through the longitudinal axis of the mussel.
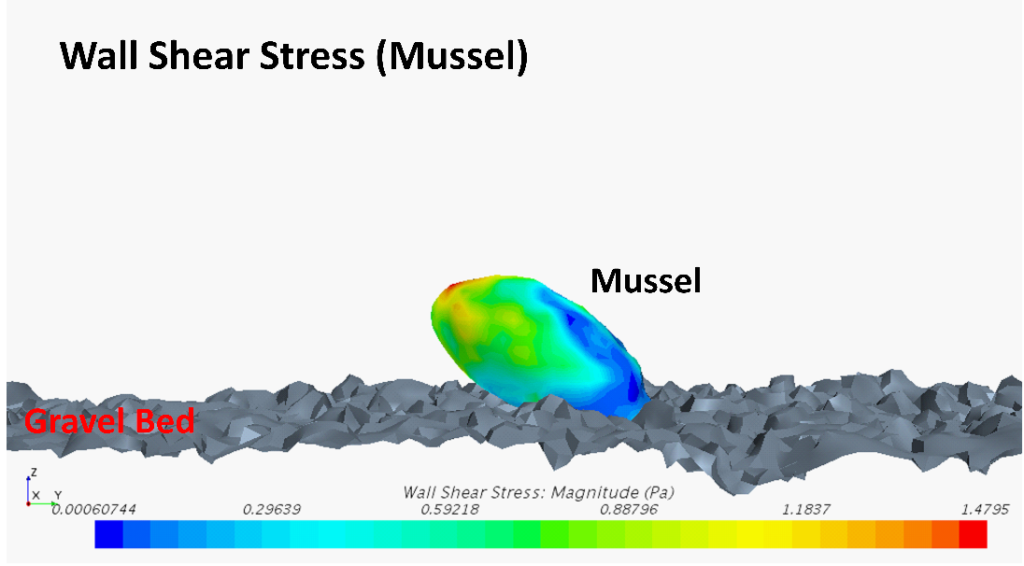
Figure 6. Example of instantaneous wall shear stress (WSS) on the mussel shell.
The next steps include comparing the model results with measured velocity profiles to validate the numerical model, then extending the study to a set of mussels disposed with different spatial density and analysing the hydrodynamic transport associated to the filtering activity of mussels, which they achieve through the incurrent and excurrent siphons located on their upper side.
2. ANALYSIS OF EFFECTS OF HYDRODYNAMIC PROCESS ON RIVER ECOSYSTEMS COMMUNITIES
Assessment and validation of mussels’ behavioral endpoints as potential indicators of hydrological stressors
WP2 – MONITORING: Task 2.3
WP3 – PROCESSES: Task 3.3
Introduction
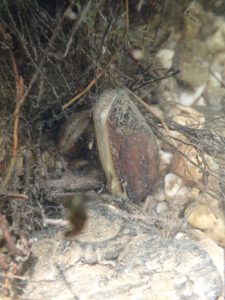
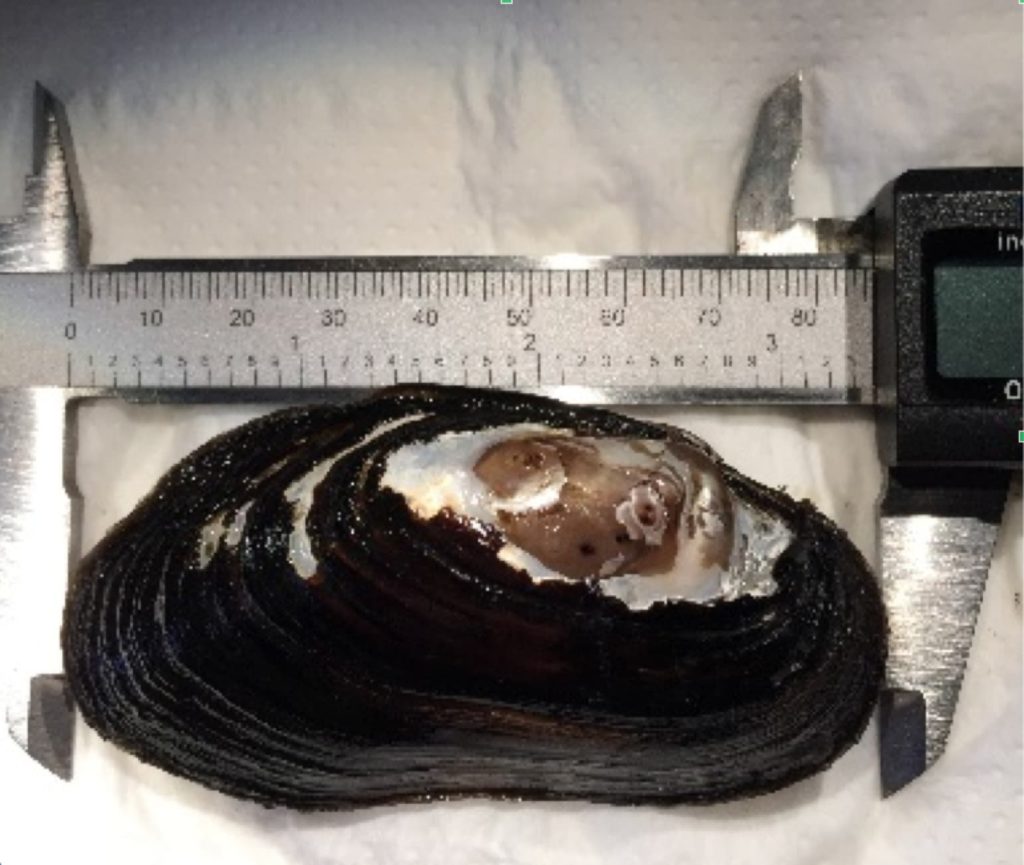
The first stage in sustainable ecosystem management is the detection of disturbance and of its impact in the target ecosystem. Environmental monitoring increasingly makes use of indicator species, that is, easily monitored organisms whose conditions reflect those of the environment where they are found. The use of these indicator species is based on the hypothesis that they can provide a response to environmental change that reflects its effects on the entire biotic community. Although the use of indicator species in environmental monitoring is reliable and cost-effective, it is quite challenging to select a specific indicator and then identify its relation with the specific stressors. The usefulness of the indicator species will strictly depend on the selected indicator species and on the selected response variables. The most suitable species to act as indicators are those with a high sensitivity to changes in their environment, while the most suitable variables are those showing an efficient and reliable relationships between the indicator species and the underlying processes of interest. Freshwater mussels (Fig 1), which are among the most sensitive freshwater organisms, also fulfill the requests for reliability, robustness, responsiveness and reproducibility that characterize a good indicator. Long used as indicators of good water quality, they have not yet been applied to detect physical disturbance factors, such as temperature and hydrological regime variations. The increasingly devastating hydrological changes affecting our rivers require monitoring methods based on rapid responses, such as those provided by behavioral reactions of mussels. The assessment of detection limits for stressors and of the exposure time needed to elicit an alarm response is necessary in order to understand the sensitivity of a sentinel-based behavioural system and its applicability to water monitoring. Valvometric responses were tested in response to chemical pollution, changes in temperature or light intensity, particulate suspended solids. However, in spite of the well-documented sensitivity of mussels to hydromorphological changes that alter flow regime, an evaluation of the eligibility of behavioural responses for detecting hydrodynamic stressor is still lacking.
Aims and ongoing activities
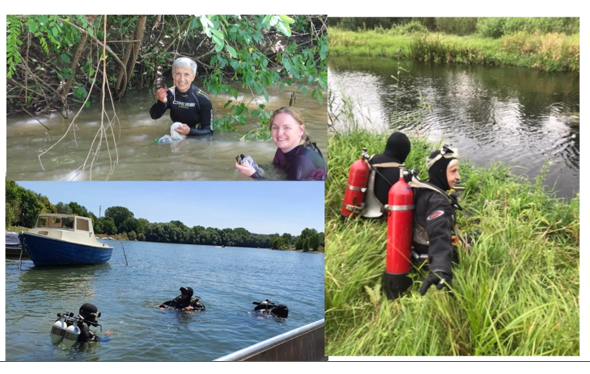
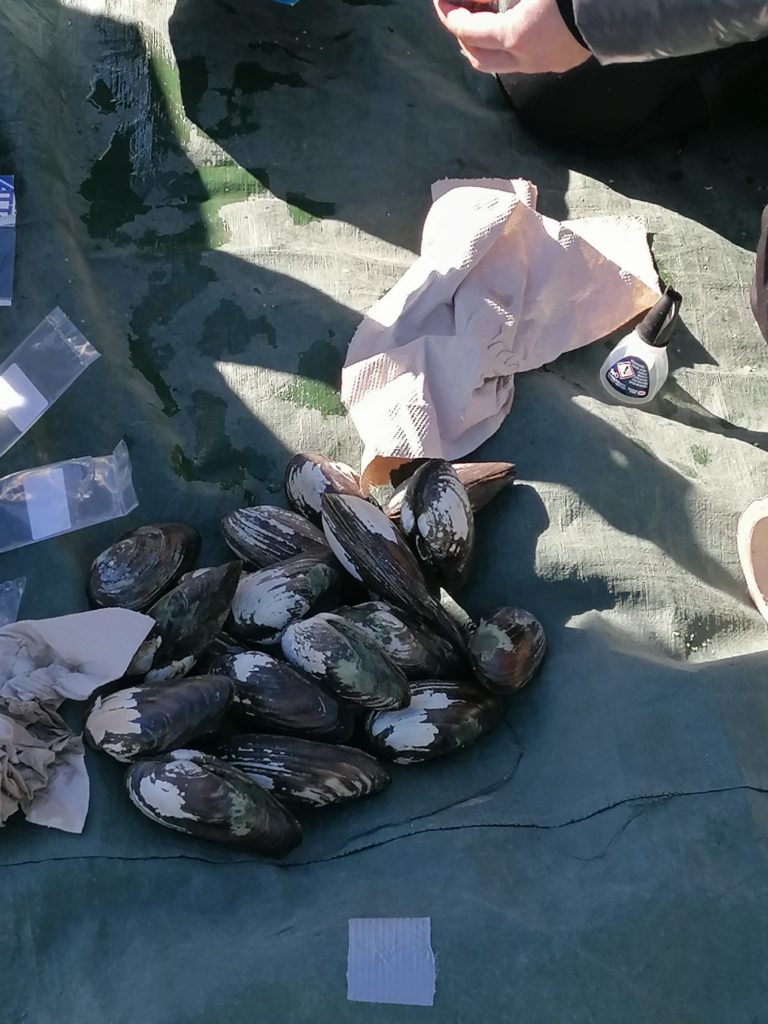
The present study will test 4 sublethal behavioural endpoints with the aim of adapting the use of animal-attached remote-sensing technology to assess of hydrological ecosystem impacts and to define vital minimum outflow (DMV) for safeguarding communities and ecosystem services. To this end, we sampled mussels from different environments (Fig. 2) and we are now testing the responses of mussels under controlled conditions (Fig. 3). Several experiments were conducted to record both the basic behavior of mussels in the absence of stressors and that in response to changes in flow (Fig. 4, 5 and 6).
Preliminary results
Preliminary results suggest that during transients and in the presence of sediment transport, mussels change their behavior, showing an increase of their valve opening-closure frequencies and amplitudes (Fig. 6). These results are encouraging to support the use of mussels as biosensor also in their natural habitat (rivers or lakes) to monitor the occurrences of natural events involving hydro-morphological variations, as floods.
3. ANALYSIS OF EFFECTS OF HYDRODYNAMIC PROCESS ON RIVER ECOSYSTEMS COMMUNITIES (Palermo University Laboratory)
Activities:
Workpackage WP2 –Tasks 2.3
Workpackage WP3 – Task 3.3
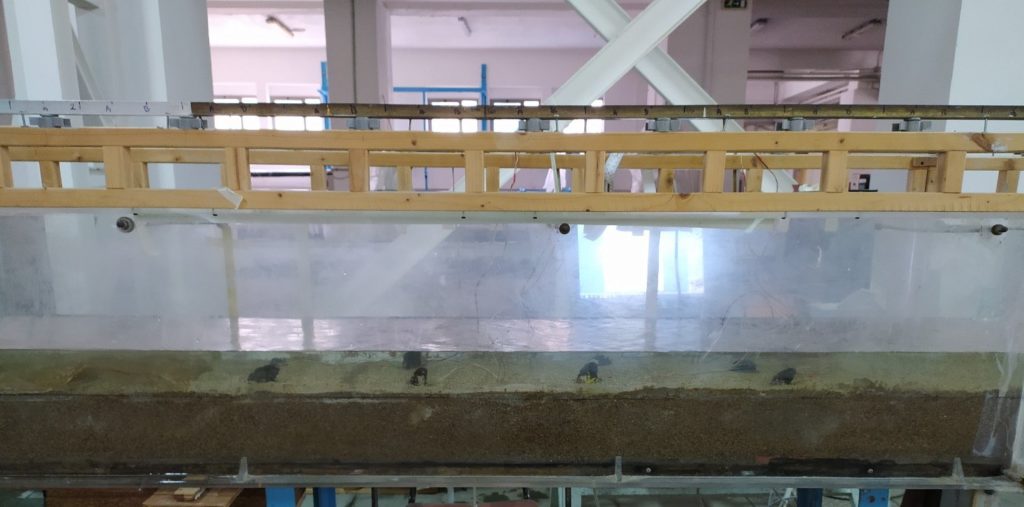
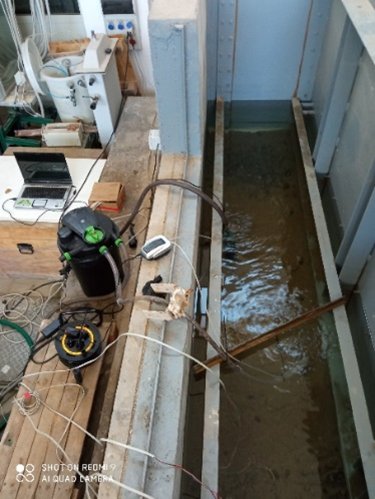
In the ambit of these activities, experiments have been conducted a straight laboratory flume constructed at the Hydraulics laboratory – University of Palermo (Italy).
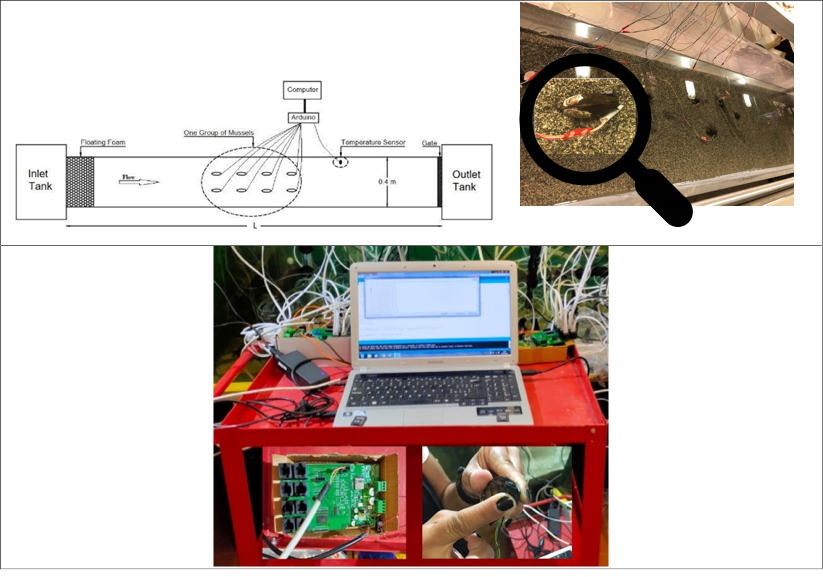
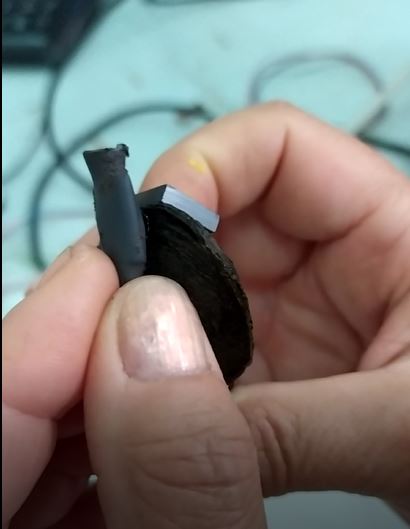
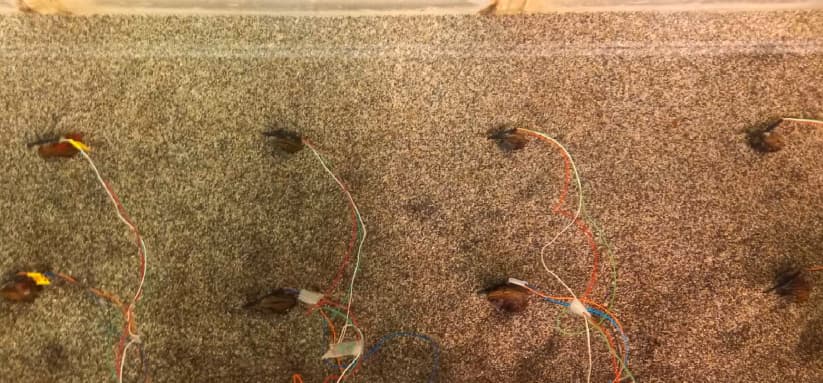
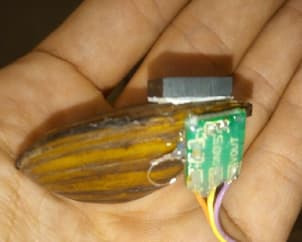
During the experiments the valve movements of mussels were monitored, as shown in Fig. 1. The Hall element sensor equipped with a serial cable were attached to the mussel valves (Fig. 2). As an example, Figure 2 shows a single mussel with sensor for the valve movements monitoring.
The aim of the aforementioned experiments was to monitor the mussel’s behavioural response due to the variation of flow discharge and in presence of sediment transport, as during a flood.
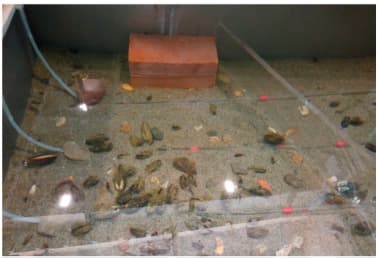
In the absence of hydrodynamic stresses (standard conditions) the valve movements were also monitored when the mussels were kept in an aquarium with dechlorinate-aerated water (Fig. 3). The aim of such an experiment was to monitor the mussel’s behavioural response due to walking movements and/or filtration.
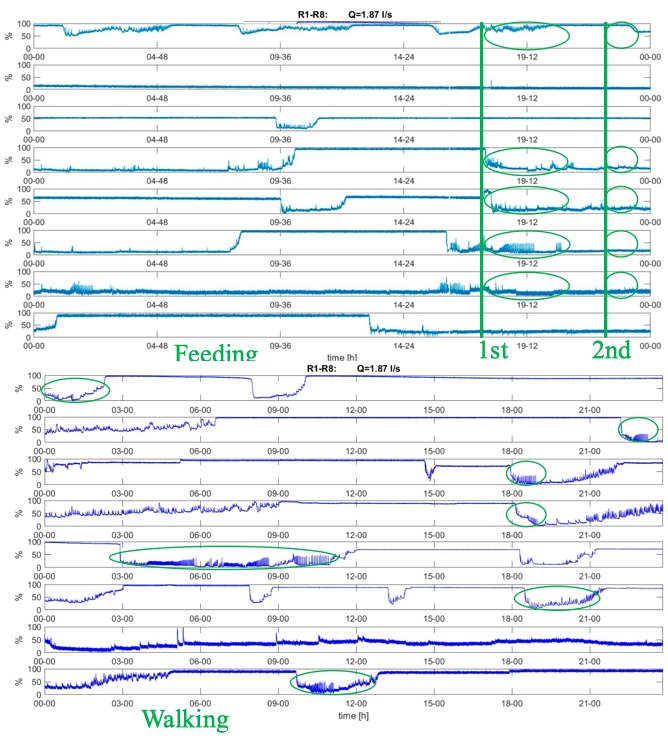
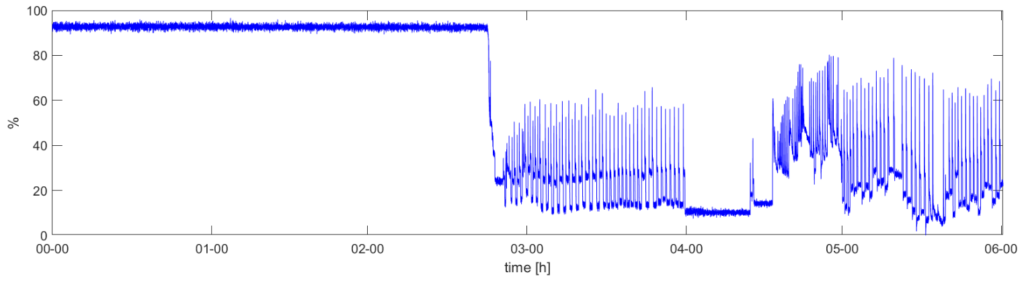
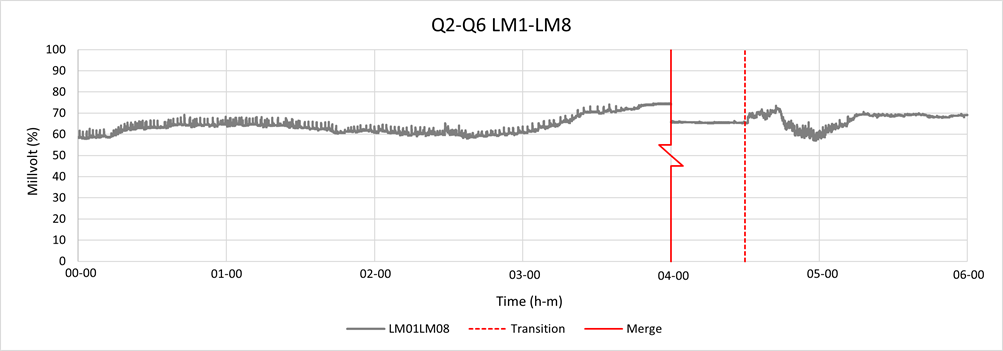
The collected data have been used to analyze the mussels’ behavioural response to hydrodynamic stresses. She statistical analysis of collected signals was performed and a Matlab code was used to estimate the frequency and the amplitude of the mussels’ response. As an example, Fig. 4 reports the average signal measured during an experimental run characterized by a sudden increase of flow rate after 4 hours from an initial value of Q2, lower to that corresponding to incipient sediment motion, to Q6, with high sediment transport.
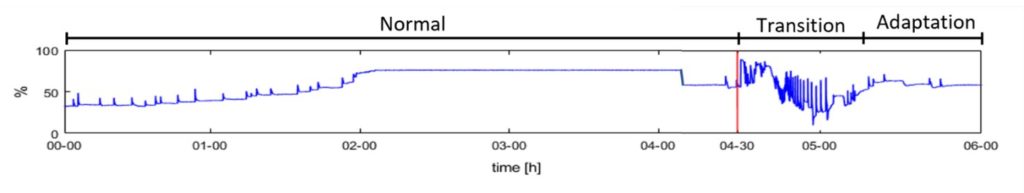
As Figure 5 shows during the aforementioned experimental run, the mussels modify their behaviour identifying a “transition” behaviour after the sudden increase of sediment transport.
Workpackage WP4 –Tasks 4.3
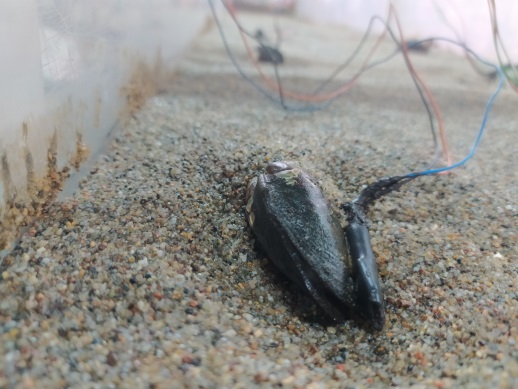
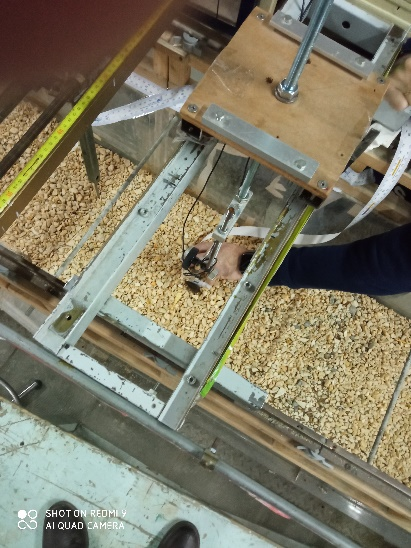
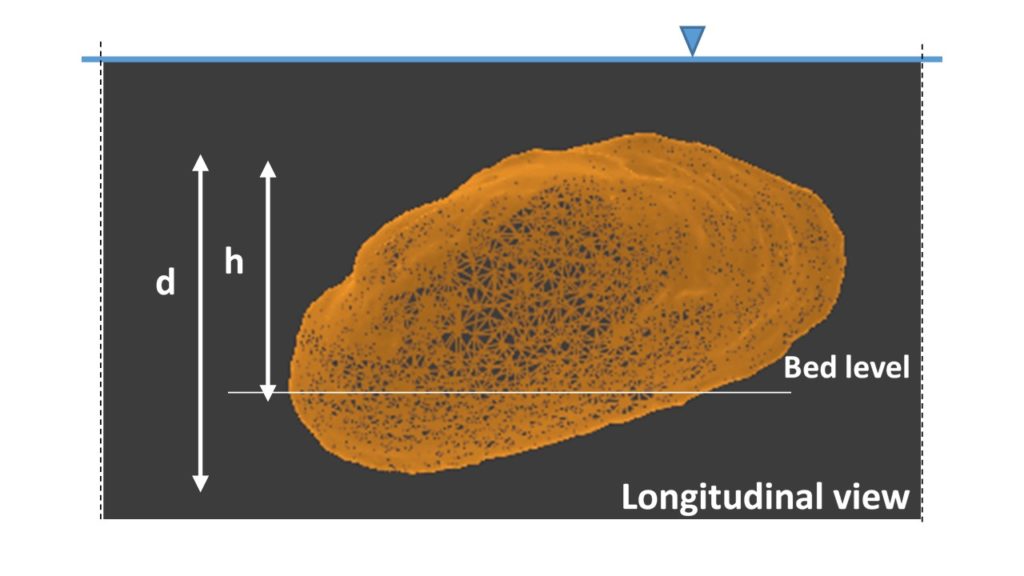
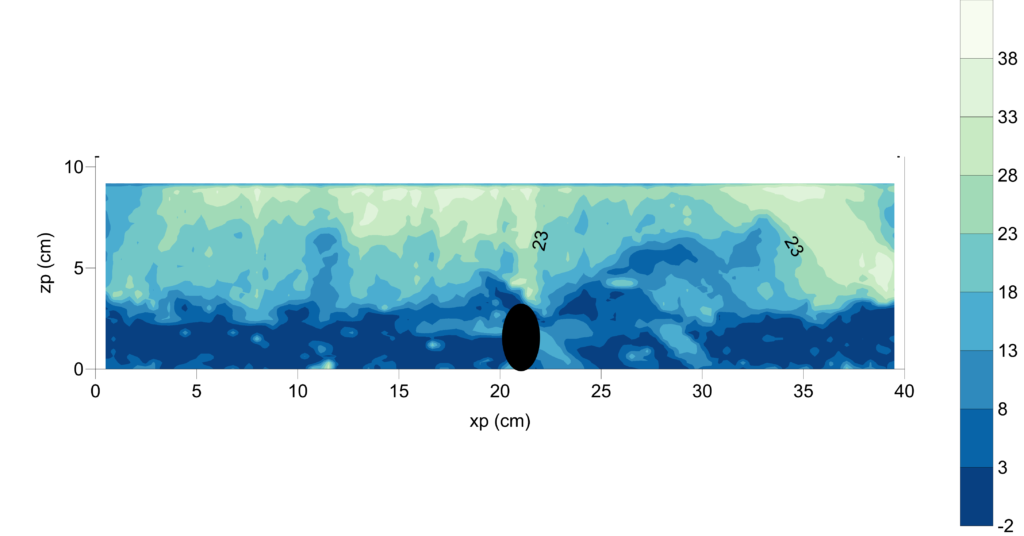
In order to analyze how the bed roughness and the presence of the animal on the bed can affect the kinematic characteristics of the flow, experimental tests have been carried out in the straight gravel-bed channel present at the hydraulic laboratory of the University of Palermo, both in the absence and in the presence of one mussel in the center of the channel (Figure 6). During the tests the instantaneous values of the longitudinal, transverse and vertical velocity components were measured in the conditions shown in the Figure 7. These data have been used to estimate the flow velocity field and the flow turbulent structure along the channel. As an example, Figure 8 shows the contour map of the preliminary results (resultant transversal velocity) obtained at section corresponding to the location of mussel’s siphons (not alive mussel). These experimental data will be also used to calibrate the 3D simulation model.
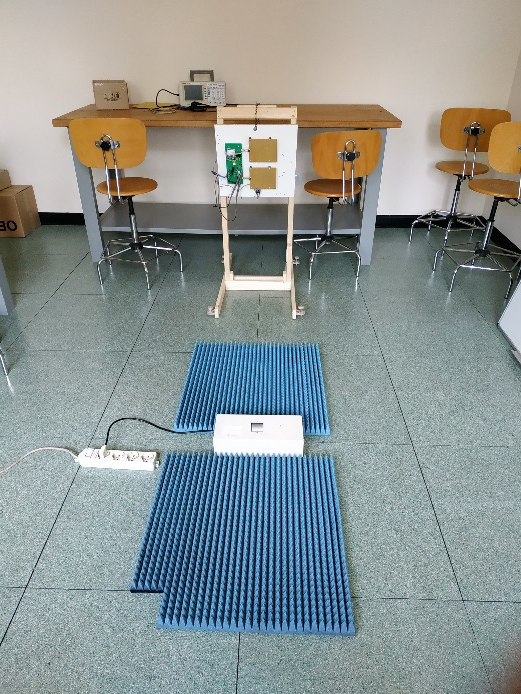
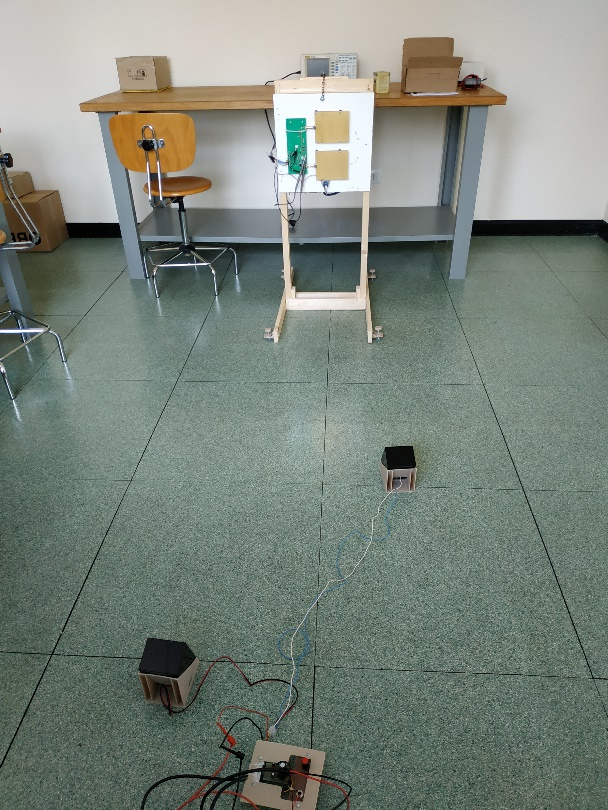
4. DEVELOPMENT OF A SYSTEM MADE OF A RADAR WITH 2 FREQUENCY-SCANNING ANTENNAS (ONE RECEIVING AND ONE TRANSMITTING)
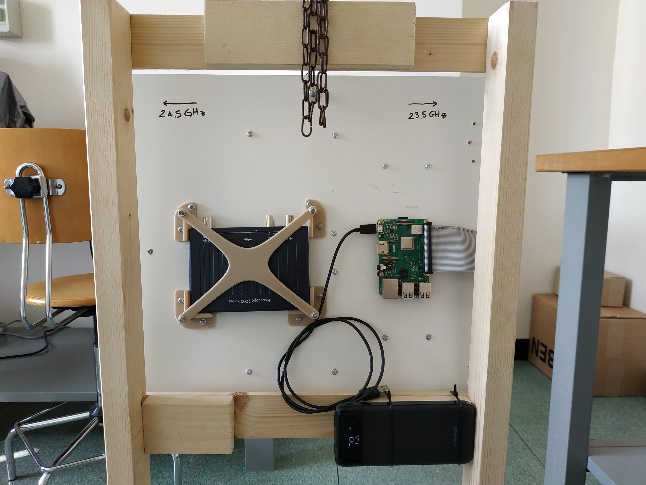
In the context of WP2 (Monitoring) and WP3 (Processes), UNIPG developed a system made of a radar with 2 antennas: one receiving and the other one transmitting.
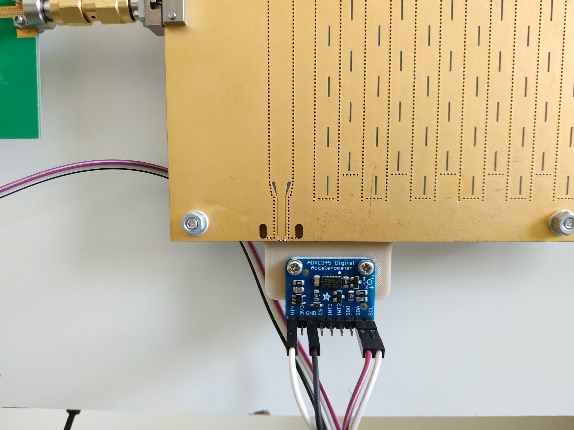
The Radar is mounted on a tilting plane. The tilt angle is automatically detected with the use of an accelerometer (ADXL345 from Analog Devices), located near the receiving antenna. The radar is battery powered with 7.4 LiPo rechargeable battery.
The radar controller is based on a Raspberry Pi 3, powered with a powerbank.
The low frequency signal is acquired with the usage of a USB oscilloscope (Picoscope 2206B), controlled with the Raspberry Pi.
The acquired data can be processed directly with the Raspberry Pi or transferred to a PC for offline processing. The Raspberry is remotely controlled with an SSH client, the file is transferred wirelessly to the PC with a SFTP client.
All the software developed for the radar (Raspberry controller and data analysis) is public and available on GitHub.
Radar controller software: https://github.com/giocic2/hydro-radar-controller
Data analysis software: https://github.com/giocic2/hrc-data
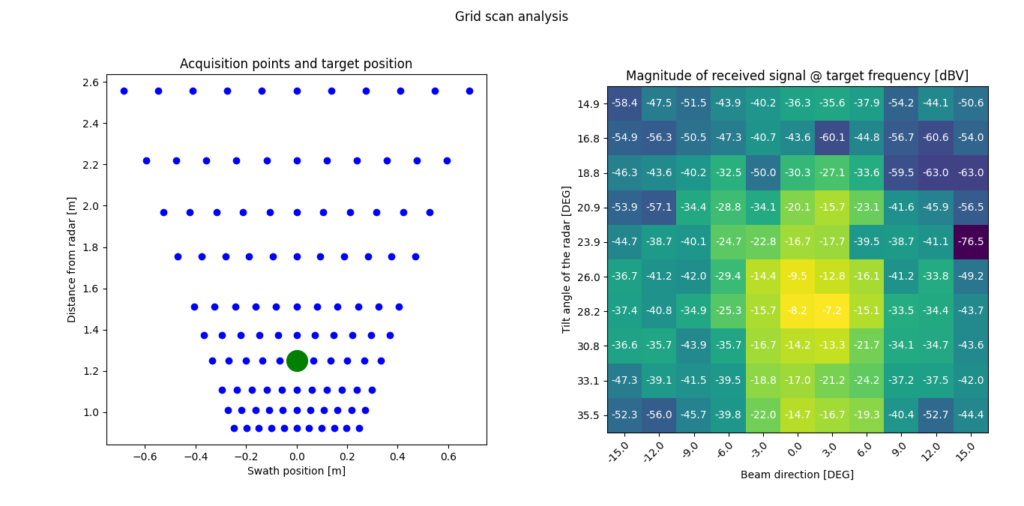
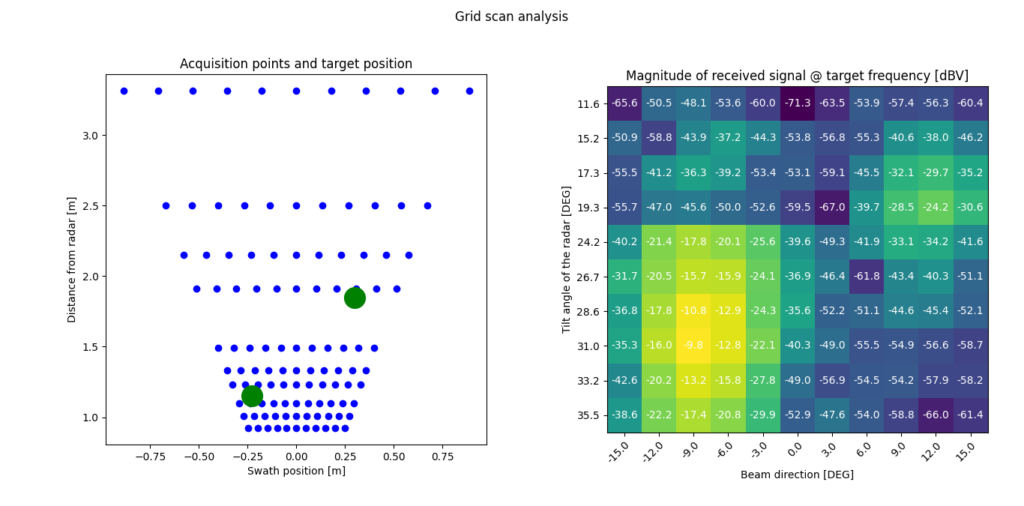
test 1 – electromechanical rotating target
The radar was used to scan a grid of points on the ground. Each point is a pair of coordinates that corresponds to a specific beam direction (horizontal coordinate) and a specific tilt angle (vertical coordinate). The beam direction is selected controlling the frequency of the transmitted signal. The tilt angle is controlled manually and automatically measured with an accelerometer.
The picture shows where is the peak of the received power, that correctly matches the target position.
Experiment procedure:
- 1) Fix tilt angle
- 2) Fix beam direction
- 3) Acquire baseband signals
- 4) Estimate received power
- 5) repeat 3), 4) changing beam direction
- 6) repeat 2), 3), 4), 5) changing tilt angle
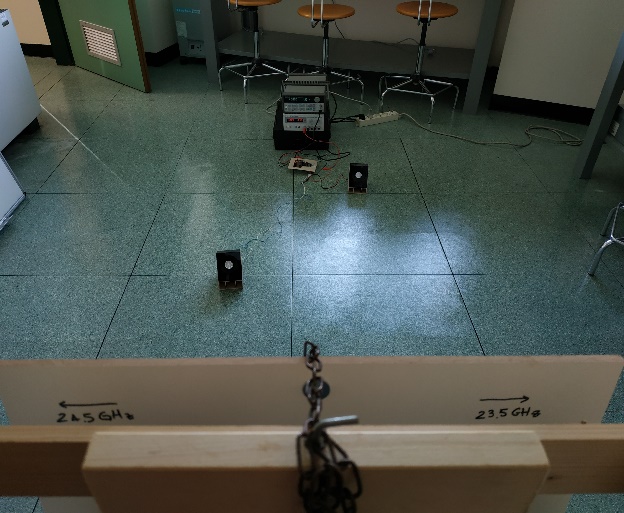
test 2 – vibrating target
The radar was also used for a second test with a vibrating target. The experiment was performed similarly to the first test.
The final picture shows where is the peak of the received power, that correctly matches the target position.
Field
1. INSTALLATION OF THE PHOTOGRAPHIC MONITORING SYSTEM OF THE PAGLIA RIVER USING LS-PIV PROCESSING
In the context of WP2 (Monitoring) and WP3 (Processes), CNR developed a photographic monitoring system and LS-PIV processing.
The final goal of the monitoring system is to provide photographic data for the measurement of the surface velocity of a river. Further requirements are the automatic high-frequency data acquisition, the data transmission in real time and an autonomous power supply.
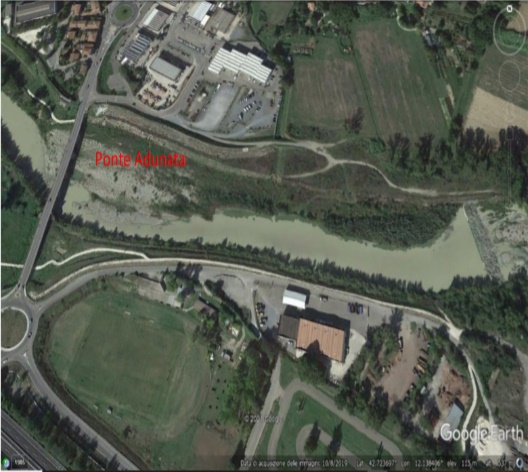
The identified site for the monitoring system installation is the Adunata Bridge in Orvieto, on the Paglia River. Specifically, the instrumentation has been installed on the parapet external side, looking downwards the river flow.
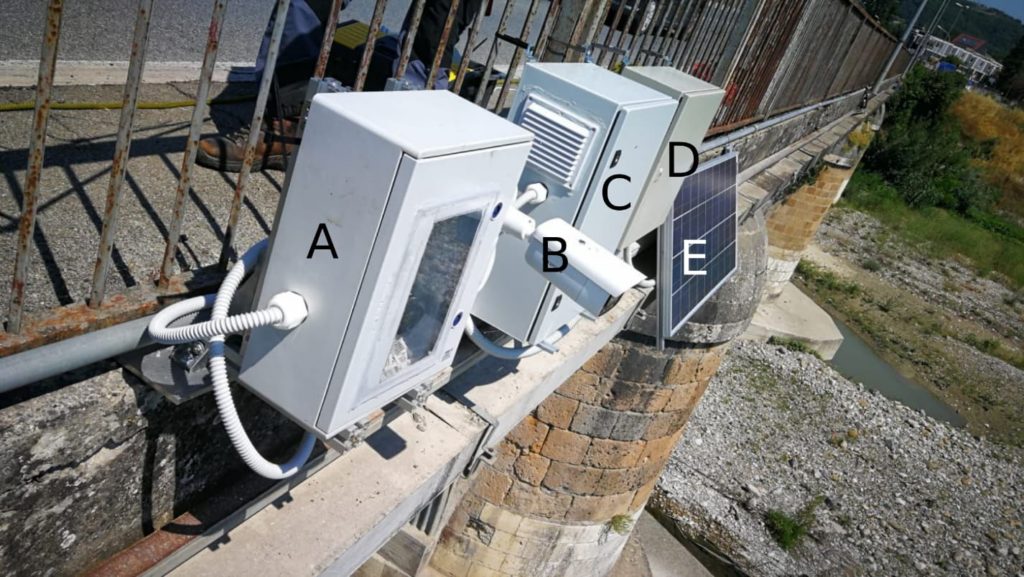
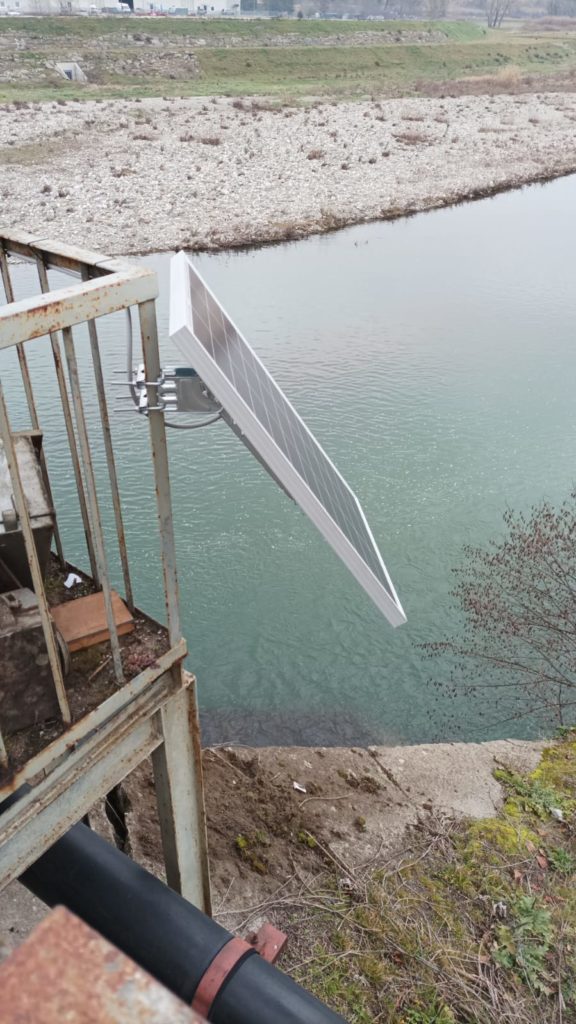
According to such requirements, it has been designed and realised a modular system composed of A) acquisition module equipped with a camera, B) surveying webcam, C) remotely controlled management module, D) power module and E) solar panel (Figure 1).
The adopted camera of the acquisition module is a 32 MPx mirrorless Canon EOS M6 mark II, equipped with 24 mm focal lens, set in autofocus mode. This camera can acquire full resolution image bursts at 14 fps. The surveying webcam is a HikVision 4K IP camera equipped with infrared sensor. The management module is composed of a Raspberry-Pi 4 that controls the photo acquisition using the gPhoto2 software released with GNU LGPL license. Additionally, the management module is equipped with a 4G modem that allows remotely access to the system. The power module includes a back-up battery and a solar panel.
INSTALLATION OF THE MONITORING STATION
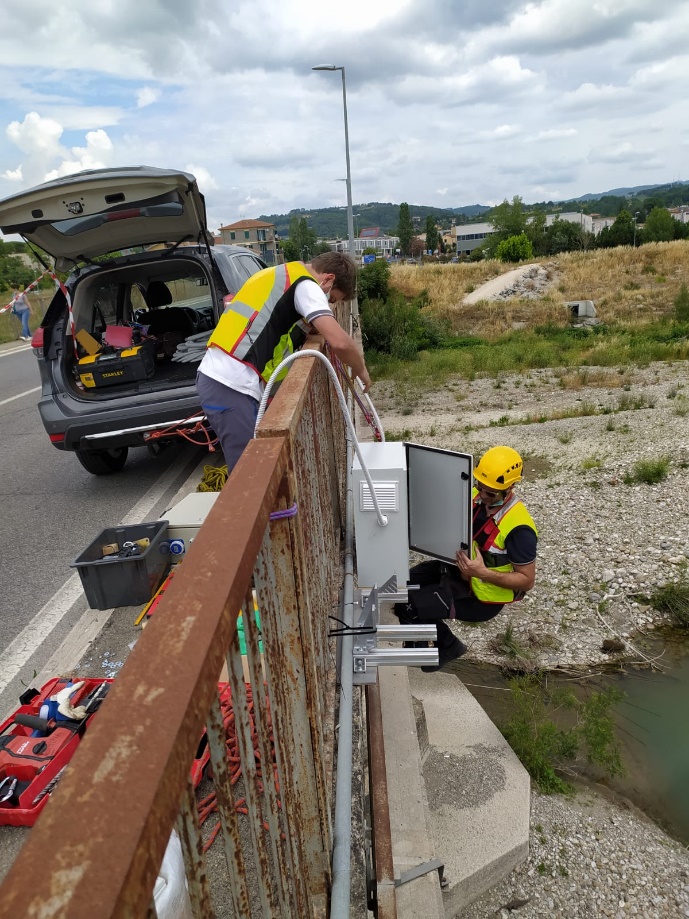
On 10 June 2021, the modular photographic monitoring system has been anchored to the bridge. The installation involved a complex intervention that required hanging operations using ropes and individual protection equipment (Figure 2).
During the intervention, it was arranged a temporary network of geocoded ground control points (GCPs) for the orthorectification of the acquired photographs (Figure 3).
On 1 September 2021, it was conducted a maintenance intervention of the monitoring system during which a UAV survey was conducted for the realisation of a high-resolution DSM and an orthophoto (Figure 4).
PRELIMINARY RESULTS
In this section, the first preliminary results obtained using LSPIV technique are briefly presented. The processed data concern a single burst at 14 fps lasted one second acquired on 7 September at 11 am.
The LSPIV processing has been conducted using LAMMA software (https://github.com/niccolodematteis/LAMMA), which has been developed by the Geohazard Monitoring Group. LAMMA uses an optimised algorithm that reduces processing times and outlier occurrence. Its adoption for LSPIV applications is still in an experimental phase.
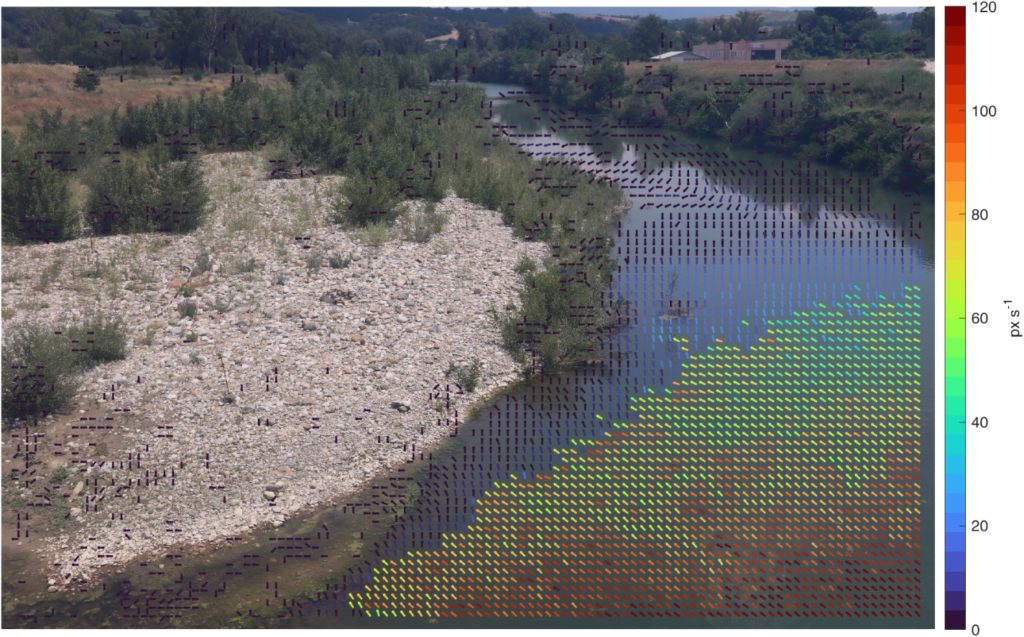
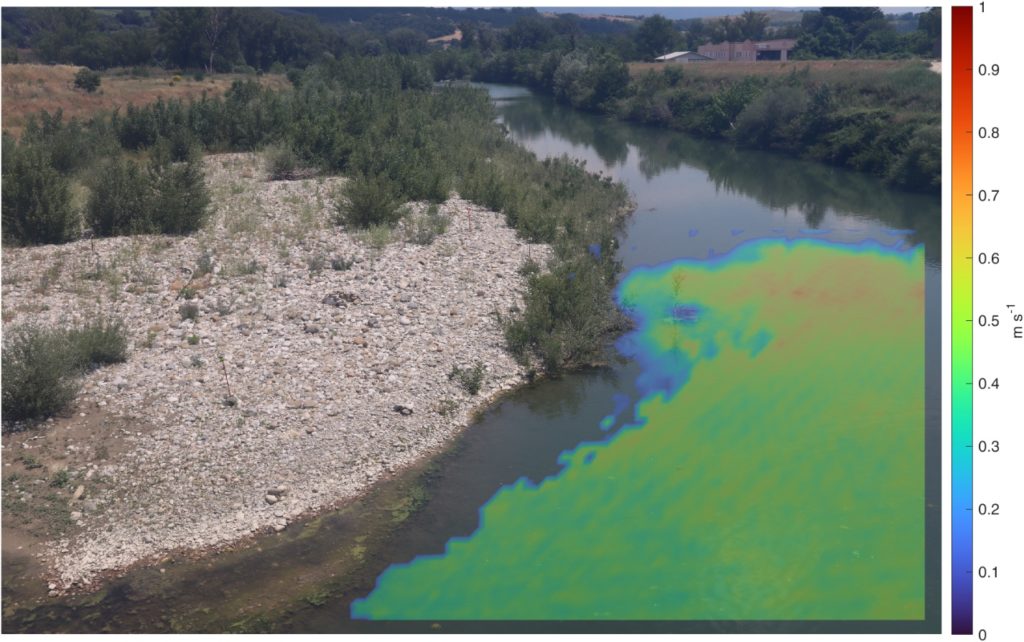
LAMMA’s output is a map of planar displacement vectors (expressed in px) lying on the image plane (Figure 5). The results geocoding is done by applying a transformation matrix that assigns to every 2D image pixel georeferenced 3D world coordinates. This allows to convert the measured displacements in metric units (Figure 6). For the geocoding operation, it was adopted the DSM acquired during the UAV survey resampled at 1 m resolution. It has been estimated a georeferencing uncertainty <1 m.
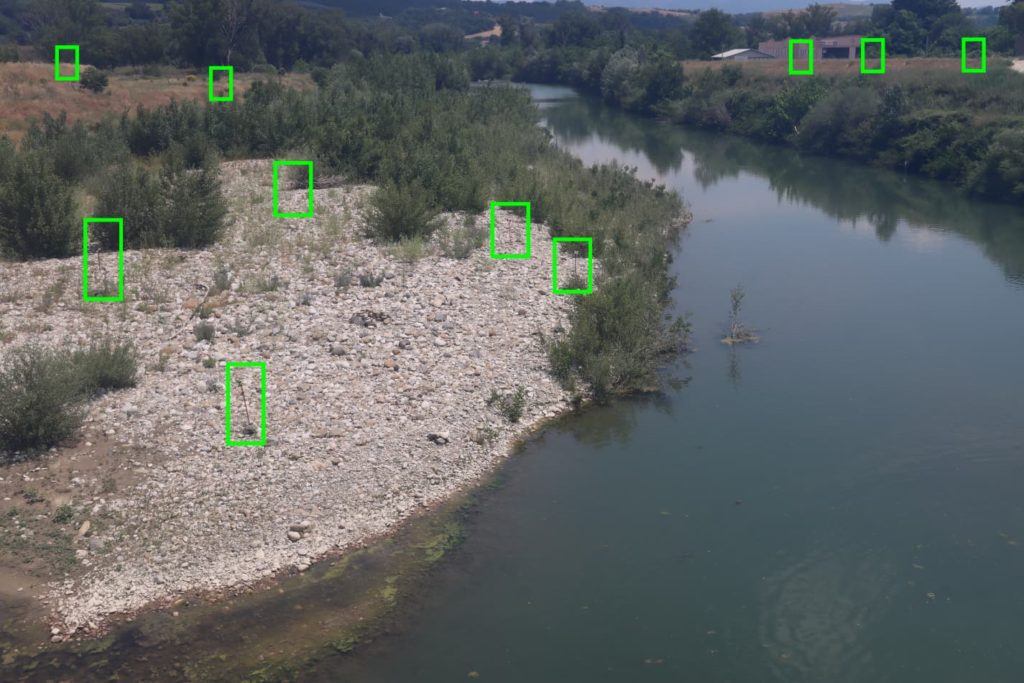
Figure 3. Image acquired by the Canon EOS M6 MArk II camera. The geocoded GCPs adopted for image orthorectification are highlighted with green boxes
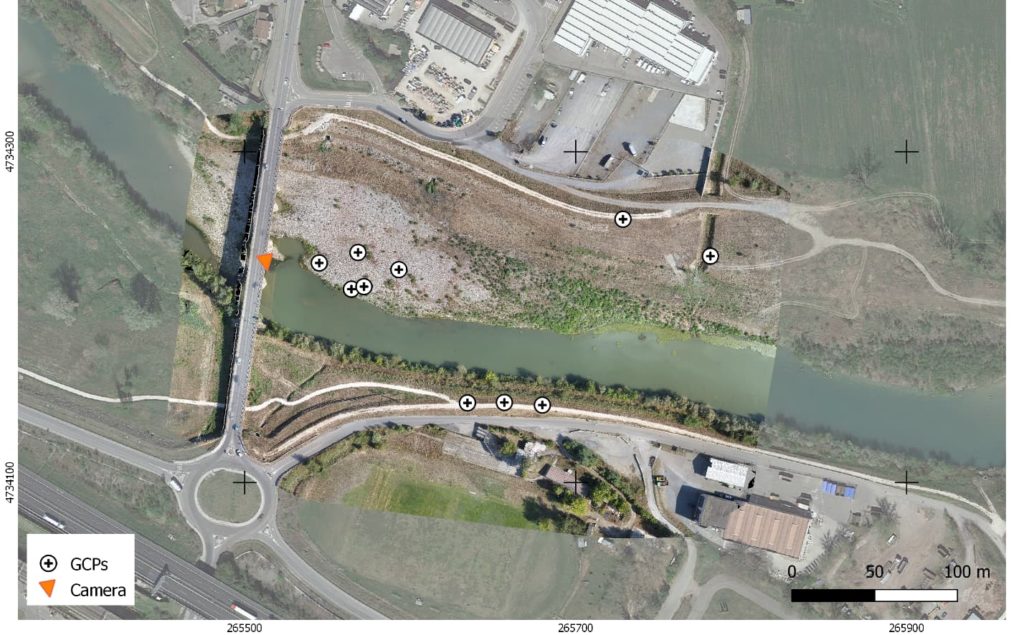
Figure 4. High -resolution orthophoto of the study site of the Adunata Bridge on the Paglia River acquired on 1 September 2021. The orange triangle indicates the position of the monitoring system, while white markers represent the GPCs.
Background: Google Earth image.
2. SURFACE VELOCITY ESTIMATE THROUGH IMAGE PROCESSING
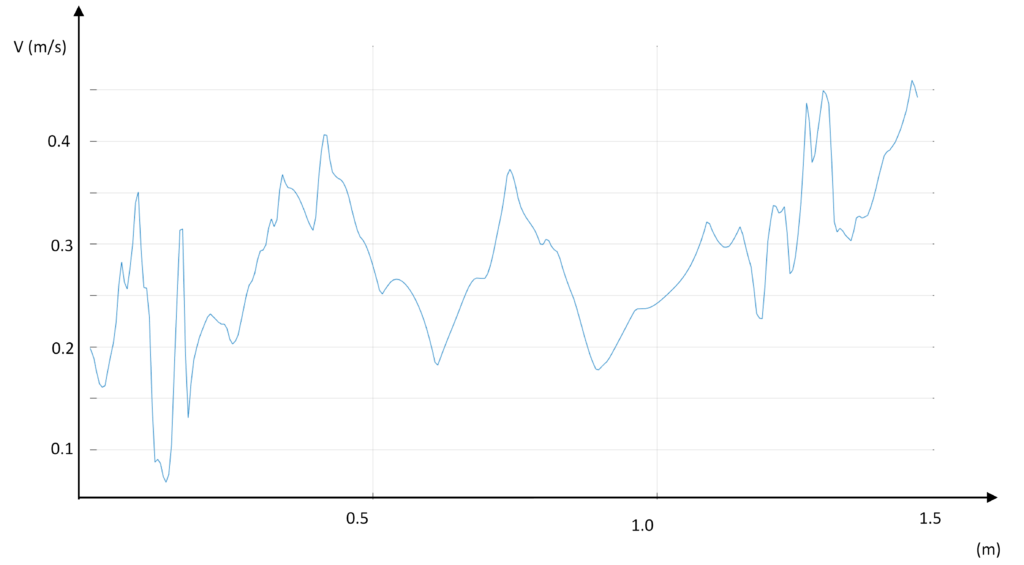
In the framework of WP1-task 2.1, an image processing procedure to evaluate the surface velocity of the flow, preliminarily calibrated at University of Palermo also by means of laboratory tests, has been applied in river sites. A first application has been conducted along a river reach of the Oreto river (Sicily) (Figure 1). Figure 2 reports the estimated spatial distribution of the free surface velocity in the examined area (area delimited by the red dashed of Figure 1) and Figure 3 reports the horizontal profile of the estimated free surface velocity along the transect A.
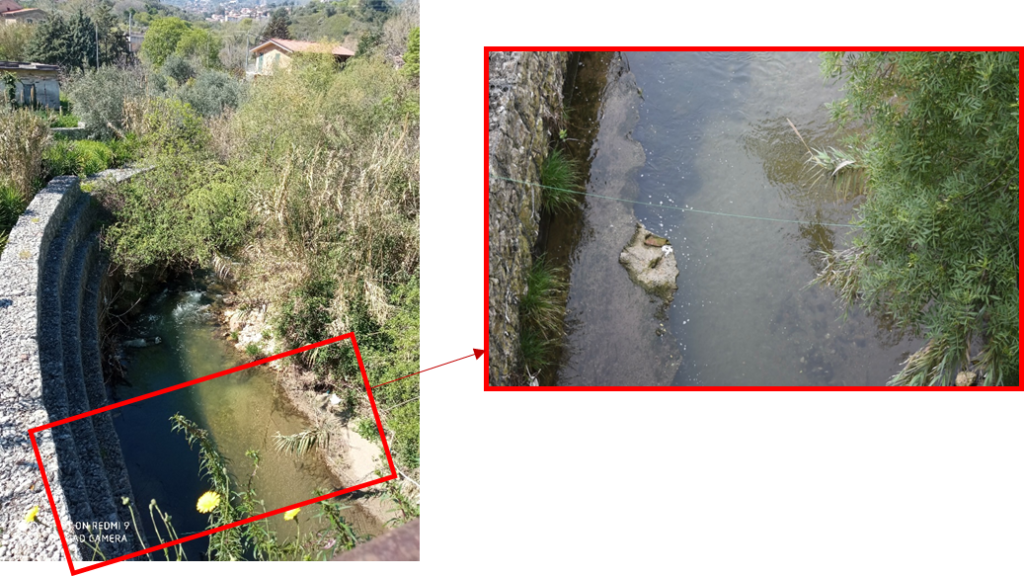
Fig. 2 Estimated surface flow velocity distribution V (m/s) in the examined area.
3. DEVELOPMENT AND APPLICATION OF TECHNIQUES FOR THE MEASUREMENT AND EVALUATION OF THE SEDIMENT TRANSPORT2.
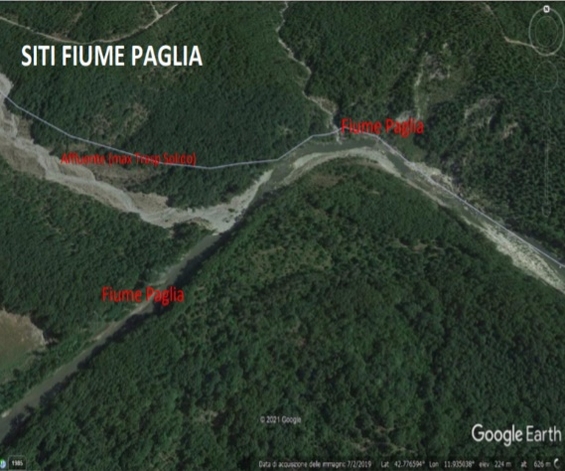
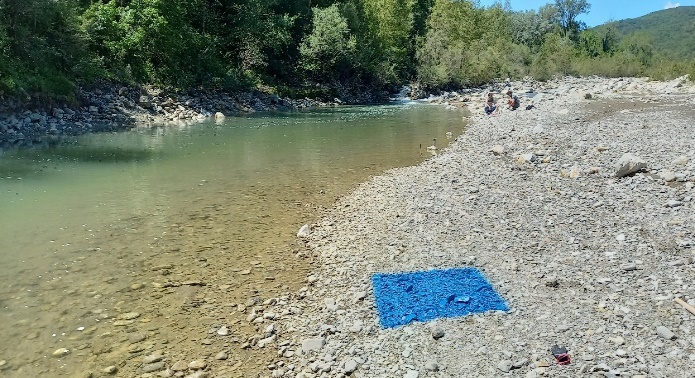
To achieve the main goals of ENTERPRISING (DEVELOPMENT AND APPLICATION OF TECHNIQUES FOR THE MEASUREMENT AND EVALUATION of THE SEDIMENT TRANSPORT), it is essential to tests all the methods out of the laboratory in the real situation. PAGLIA river is the first river that our group is interested in working on it. Three zones have been chosen along the river for field study.
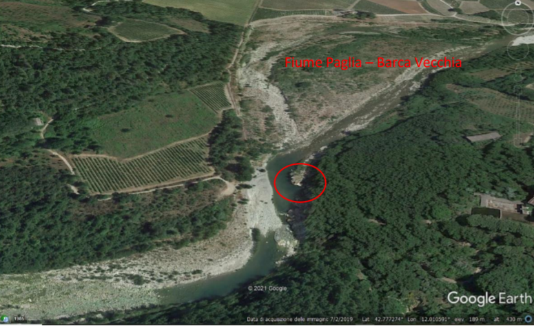
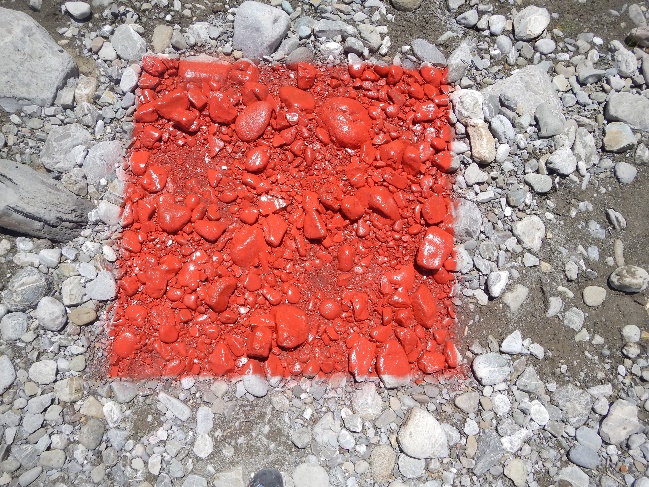
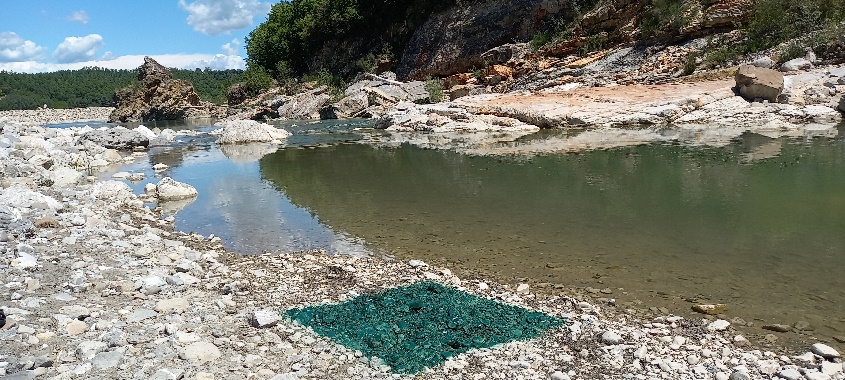
Monitoring the sediment transportation by using colored sediment in floodplain
To understand the capacity of erosion in the floodplain (Riverside) area in Barca-Vecchia location, some squares (1*1 meter) are colored on the riverside. During the Flood, some sediments move and after the flood by disappearing colored sediment on the squares, it is easy to calculate the percentage of erosion in this area.
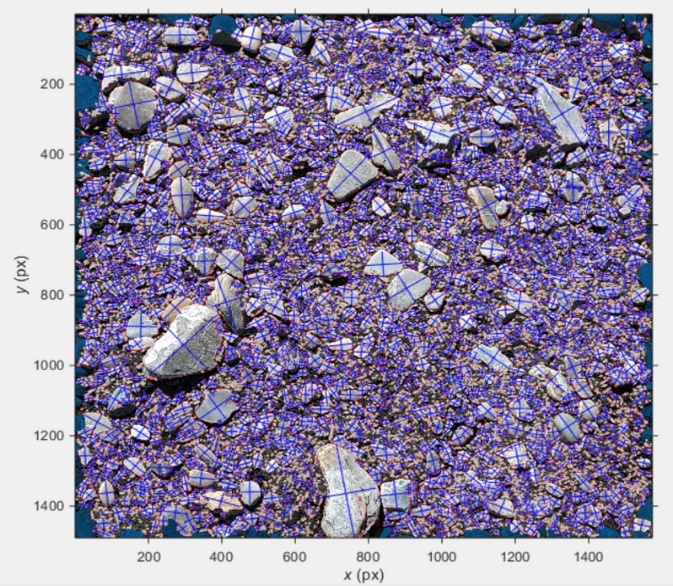
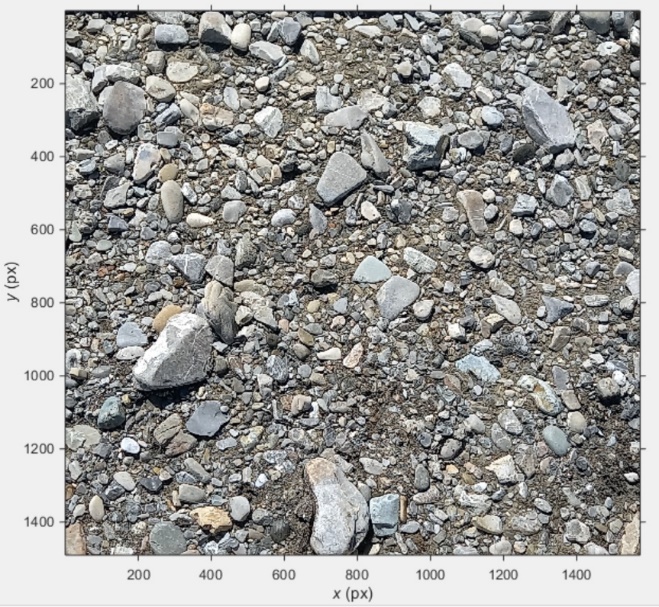
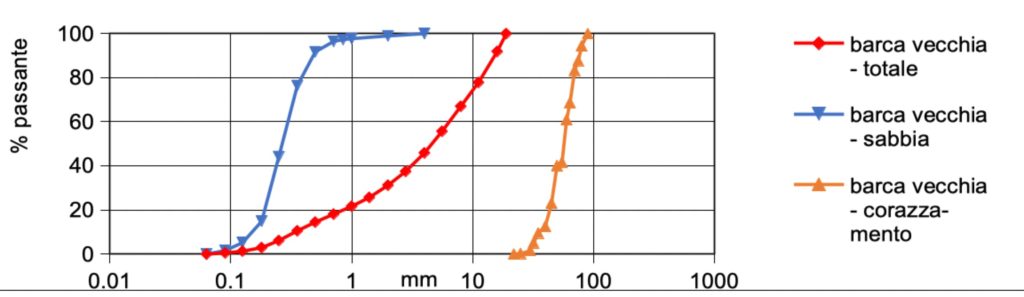
Grain size curve by using photogrammetry
One of the new methods which replicate the old method for providing the grain-size curve is Photogrammetry by using the BaseGrain software. This software can realize the grain size of sediments on the pictures. The result of this method for riverside in Barca-Vecchia shows we can trust this method.
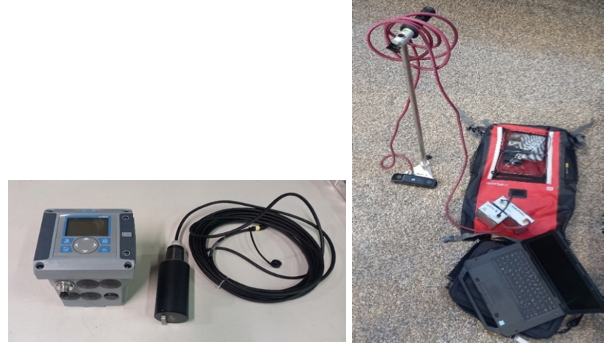
Turbidimeters and hydroprofilometer
New tools with more accuracy can help us to collect data closer to the real data. Modern TURBIDIMETERS lets us do accurate, reliable turbidity measurements, and HYDROPROFILOMETER measures the velocity and water level, and temperature in shallow water by ultrasonic sensors. These tools passed some tests and now, they are ready to install in Ponte-Adunata zone.
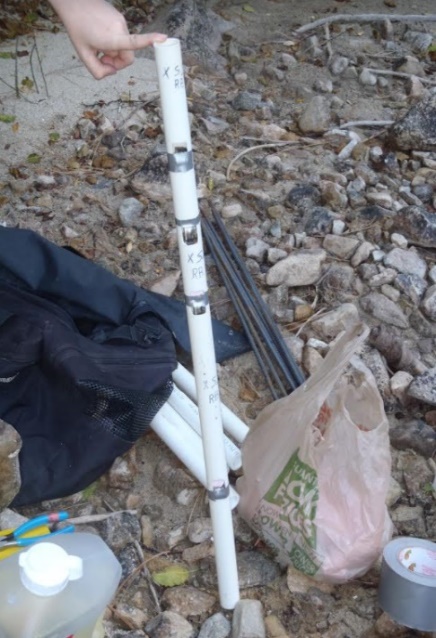
Temperature bar
Some studies have shown the changing the temperature in each layer of riverbed can tell us about erosion in this cross-section. If some vertical sensor bars install on the riverbed and receive data remotely, we can observe the erosion live! Based on the previous investigation on this issue, we found suitable spots to install the bars in Barca-Vecchia.
Mussel and climatic disturbances
Mussels have been used as biological monitors since 1986 in Germany, and nowadays many countries worldwide use them in real-time monitoring systems to detect disturbances in ecosystems, including surface water, groundwater, effluent, and drinking water. Valvometry uses the mussels’ capacity to open and close their shells when exposed to abnormal conditions as an alarm to indicate possible disturbances in the environment. Hall sensor technologies and Arduino software were used to recording the valve movements of mussels. By collecting these signals in some different hydraulic conditions, and turn them to frequency and amplitude, it would be easy to realize the mussel’s behaviour in each hydraulic condition. In Barca-Vecchia and Ponte-Adunata some places have been chosen for cages of mussels on two sides of the river.
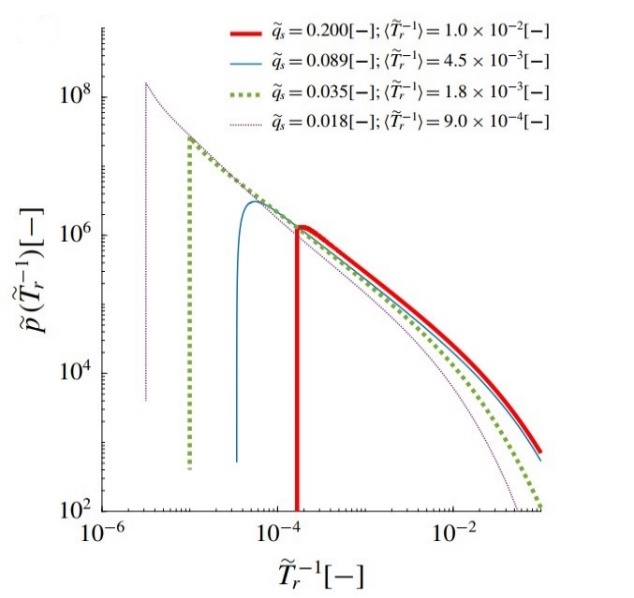
Refinement of the entropy-based methodology
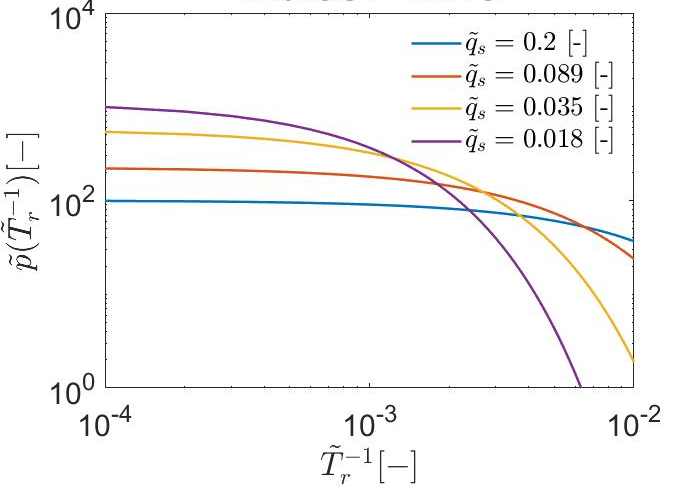
UNITN group developed and applied the entropy (Shannon-Tsallis) pdf distribution of the resting time and the length in ordinary bedload based on Einstein’s theory. The comparison of two entropy distribution (Shannon-Tsallis) illustrates that the results of both methods are close. The following graphs show the pdf distribution of resting time made by Luigi and Hassan using Einstein’s theory (fig. Right) and the results of the entropic distribution of Tsallis of resting time (fig. Left), both for different values of sediment discharge (qs).
News
- Monitoring systems with mussels in the cages installed in the Paglia River section are operative
The installation of the mussel monitoring stations has been finalized. The system on the pile of the bridge has been made operative on 31st March 2022 just before the occurrence of a flood event (maximum water level =2.73 m).
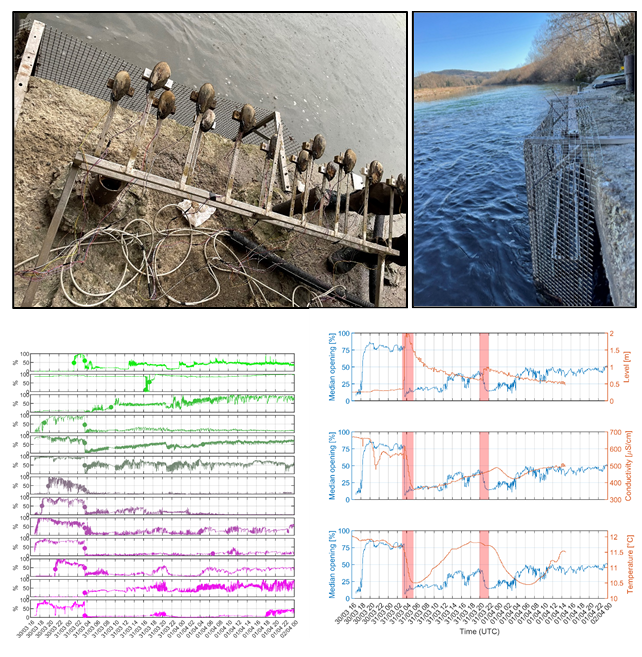
Preliminary results based on the comparison between the median mussels’ opening (0%=closed, 100%=open, figure on the left) and water level, conductivity and temperature measured by the multiparametric probe (figure on the right) show that the mussels clearly and immediately reacting to increasing water level, not only during the two peaks of the flood, but also in correspondence of the small water level variations around 21:30 and 00:30 of the first night. It is also interesting to notice that the behavior of the mussels is quite comparable among the 13 individuals.
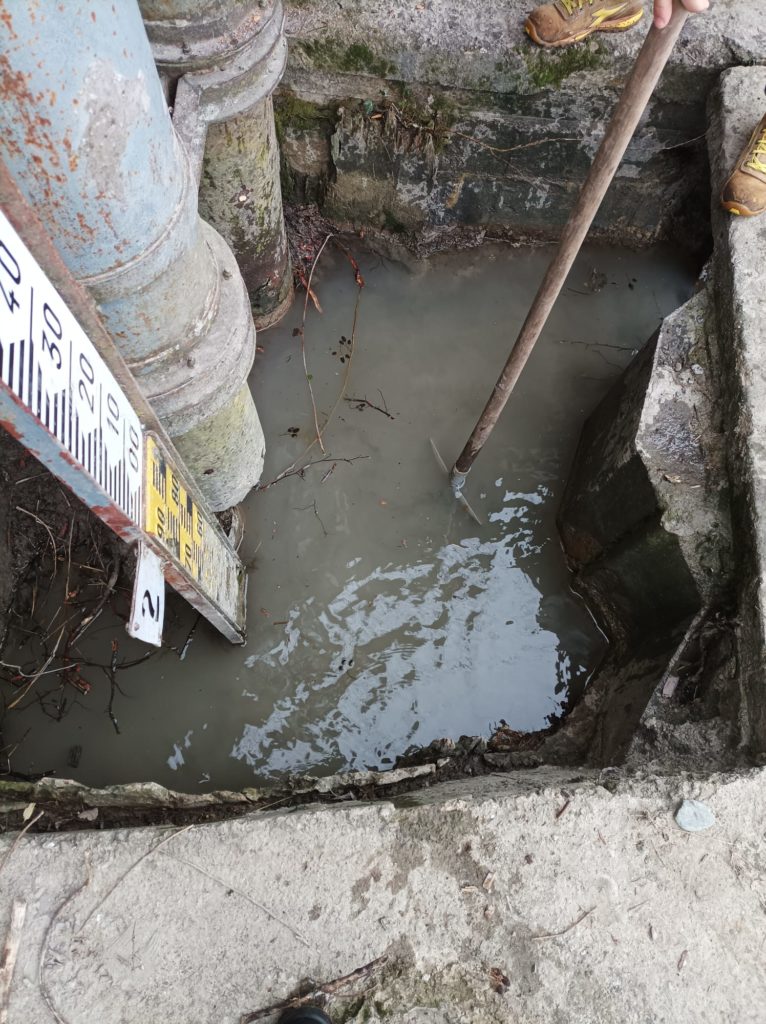
The system in the lateral pool under the bridge has been finalized and made operative on 7th April 2022.
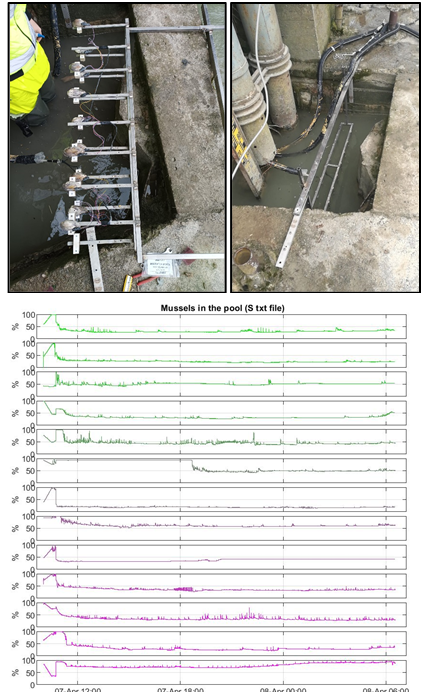
The figure shows the median mussels’ opening recorded for this second monitoring system. - Cages installation in the Paglia River section
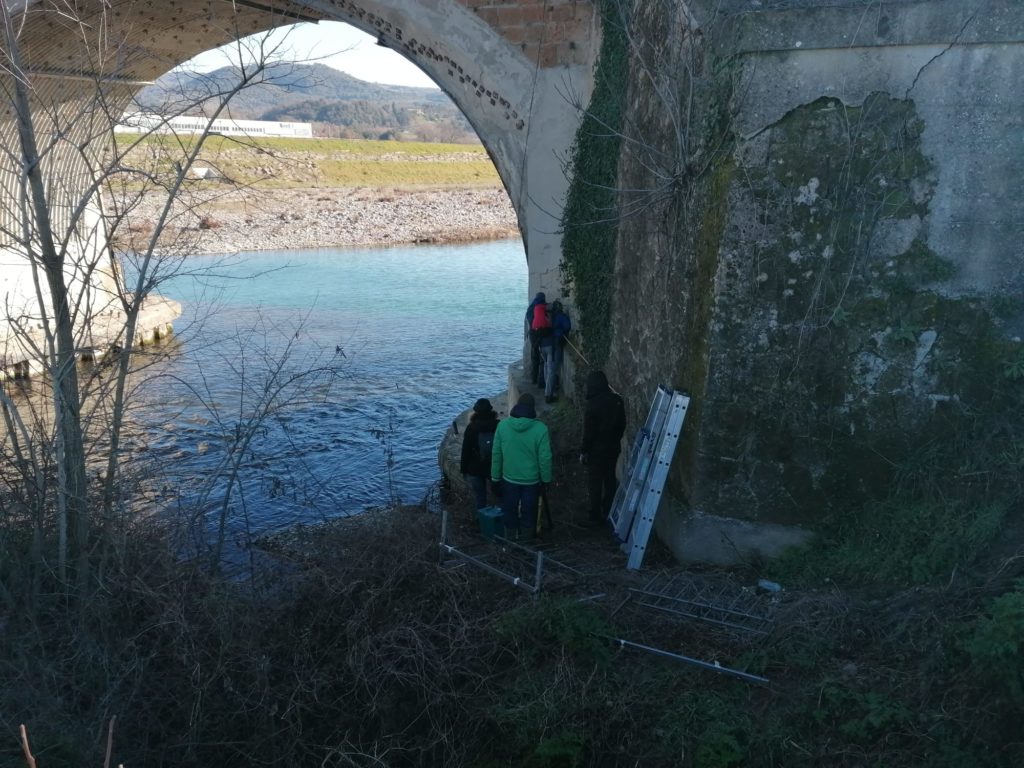
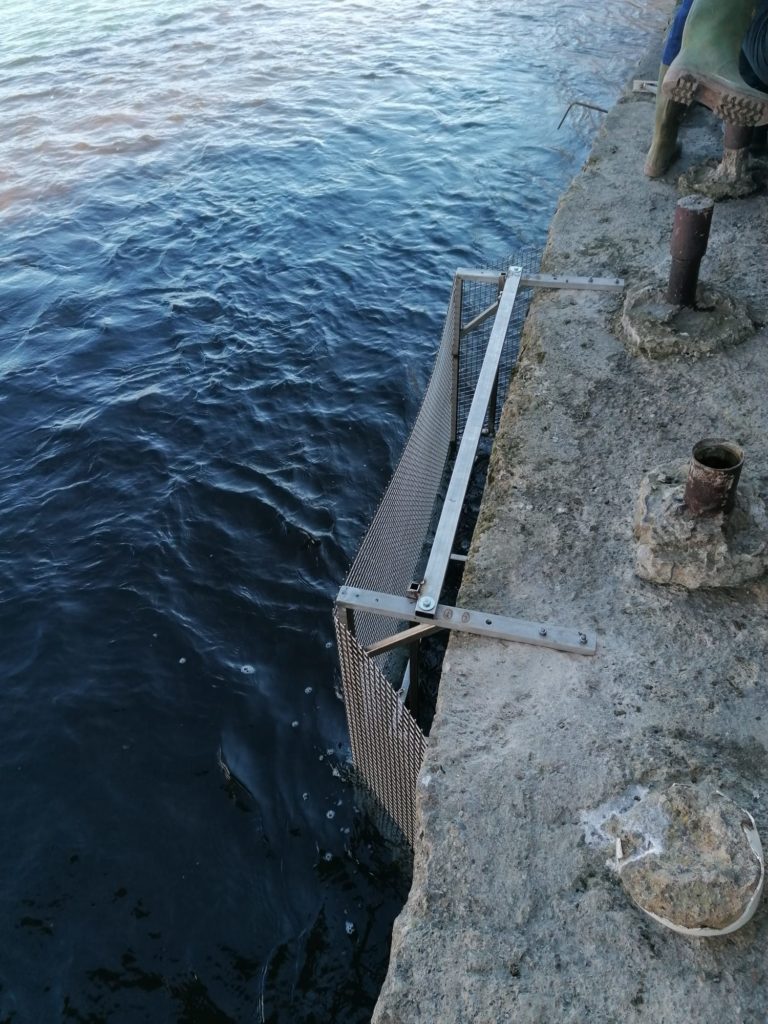
The cages with the mussels for the analysis of the effects of hydrodynamic on the biosensors in a natural environment have been installed in Orvieto site (1-2 February 2022).
- New Publication
F. Bahmanpouri, S. Barbetta, C. Gualtieri, M. Ianniruberto, N. Filizola, D. Termini, T. Moramarco, Prediction of river discharges at confluences based on Entropy theory and surface-velocity measurements, Journal of Hydrology, 2022, 127404, ISSN 0022-1694, https://doi.org/10.1016/j.jhydrol.2021.127404.
- Field trip in Orvieto
Field trip carried out by all partners of the project at the field case study of Orvieto (Paglia River Basin) on Thursday 11 November 2021.
The location for the cage with the mussels for the filed analysis has been identified and soon it will be installed.
The selected site is Ponte Adunata section, on the right side of the bridge. Here the water level and the surface velocity are continuously monitored.
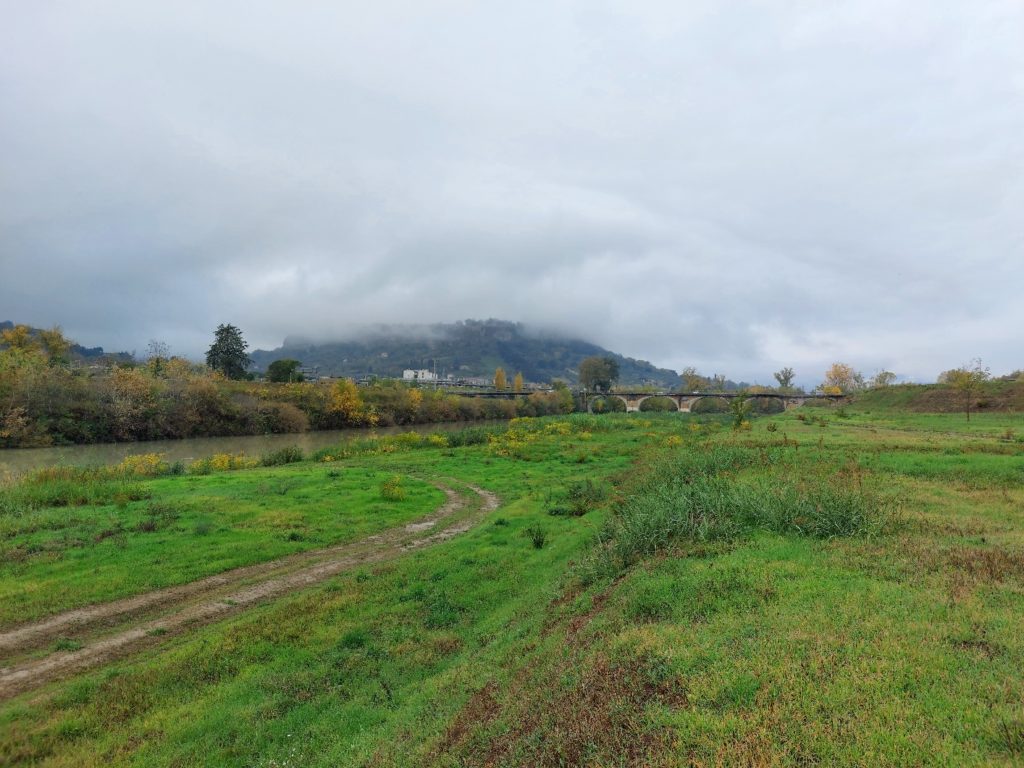
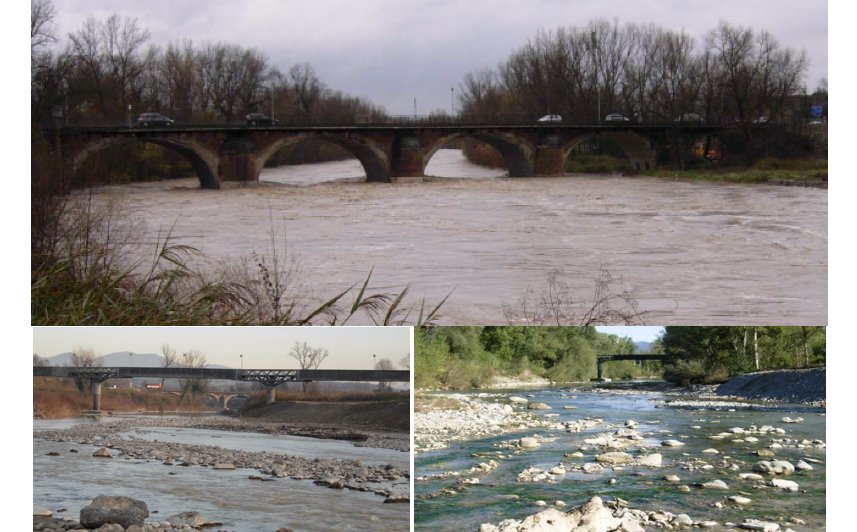
Ponte Adunata bridge on the Paglia River (downstream side view). 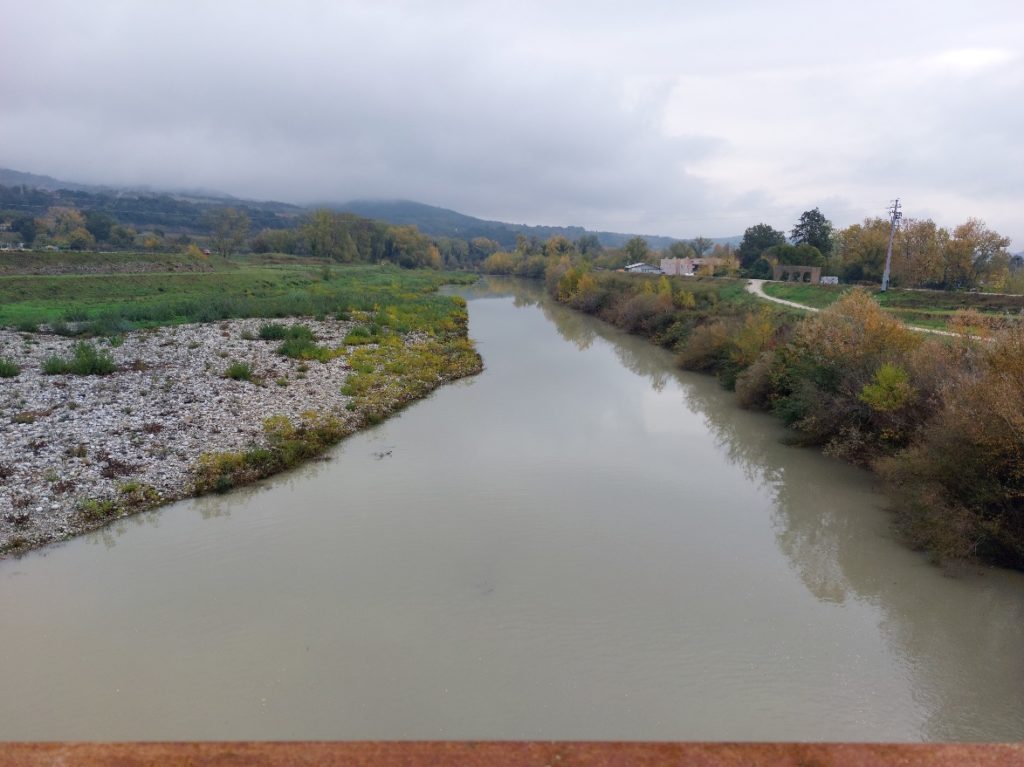
Paglia River (seen from Ponte Adunata, downstream side view).
Datasets
Case study
Laboratory
The impact of various hydro-morphological features on mussels are checked in controlled conditions during laboratory experiments (Palermo and Trento University).
The experiments in the ambit of WP2-task 2.3 and WP3-task 3.3 in the Hydraulics laboratory of University of Palermo have been conducted in two straight flumes. The first flume is 60 cm wide and 26 m long and it is characterized by a horizontal bed and only water can be recirculated. The second flume is 40 cm wide and 11 m long and it is characterized by sand-bed with longitudinal slope of about 0.1%. In this last flume both water and sand can be recirculated.
Field case study
A prolonged monitoring of the biotic behavior in a fluvial system will be performed at Orvieto Scalo hydrometric section (Ponte Adunata Bridge) on Paglia River subtending a basin area of about 1200 km2. The Paglia river is a right tributary of Tiber River, subjected to flooding and high sediment transport. Data on water level, surface velocity are available at sub-hourly time resolution.
Publications
Conference papers/abstracts
- G. Cicioni, G. Orecchini, R. V. Gatti, V. Palazzi, P. Mezzanotte, L. Roselli, F. Alimenti, “Frequency Scanning Surface Velocity Radar for River Monitoring”, 2023 IEEE MTT-S International Microwave Symposium (IMS), San Diego, California, 2023.
- G. Cicioni, R. Salvati, R. V. Gatti, V. Palazzi, P. Mezzanotte, L. Roselli, F. Alimenti, “24-GHz Frequency Scanning Doppler Vibrometer”, 2023 IEEE Topical Conference on Wireless Sensors and Sensor Networks (WiSNeT), Las Vegas, Nevada, 2023.
- G. Cicioni, R. Salvati, R. V. Gatti, V. Palazzi, P. Mezzanotte, L. Roselli, F. Alimenti, “Evaluation of the Frequency Response of Electro-Mechanical Actuators with a Zero-IF 24-GHz Doppler Vibrometer,” 2022 29th IEEE International Conference on Electronics, Circuits and Systems (ICECS), Glasgow, United Kingdom, 2022, pp. 1-4, doi: 10.1109/ICECS202256217.2022.9971048. URL: https://ieeexplore.ieee.org/stamp/stamp.jsp?tp=&arnumber=9971048&isnumber=9970770.
- Pilbala A., Tosato L., Modesto V., Benistati N., Piccolroaz S., Fraccarollo L., Termini D., Manca D., Moramarco T., Riccardi N. ‘Evaluating Hydrological stressors by Monitoring Mussel Behaviours’. 7th Europe Congress of IAHR (the International Association for Hydro-environment Engineering and Research), Sep 7, 2022, https://www.erasmus.gr/microsites/1227/book-of-abstracts.
- Pilbala A., Tosato L., Fraccarollo L., Bahmanpouri F., Moramarco T. ‘Shannon and Tsallis entropy results for particle resting times and jump lengths in river bedload’. EGU General Assembly 2022, May 27, 2022, https://doi.org/10.5194/egusphere-egu22-11317.
- Bahmanpouri, F., Termini, D., Barbetta, S., Moramarco, T., (2022). Application of the Entropy concept to calculate the spatial metrics of the river flow. Hydrology days (Le Giornate dell’Idrologia della Società Idrologica Italiana) 2022, Genova, 9-11 Novembre 2022.
- Bahmanpouri, F., Barbetta, S., Gualtieri, C., Ianniruberto, M., Filizola, N., Termini, D., Moramarco, T. (2021) “Estimating the hydrodynamic and morphodynamic characteristics using Entropy theory at the confluence of Negro and Solimões Rivers”, EGU General Assembly Apr. 2021. https://doi.org/10.5194/egusphere-egu21-10330.
- Bahmanpouri, F., Eltner, A., Barbetta, S., Bertalan, L., Moramarco, T. (2021). Estimating the velocity and discharge rates using the Entropy approach based on a single surface velocity measurement. Hydrology days ( Le Giornate dell’Idrologia della Società Idrologica Italiana) 2021, Napoli, 29 settembre 2021.
International Scientific Journals
- 2023
- Lazzarin T., Constantinescu G., Di Micco L., Wu H., Lavignani F., Lo Brutto M., Termini D., Viero D.P. (2023), Influence of bed roughness on flow and turbulence structure around a partially-buried, isolated freshwater mussel. Water Resources Research, https://doi.org/10.1029/2022WR034151.
- Bahmanpouri F., Termini D., Barbetta S., Dionigi M., Moramarco T. (2023), Significance of hydraulic complexity parameters M1 and M2 based on laboratory and field data. Hydrology Research 2023; nh2023089. doi: https://doi.org/10.2166/nh.2023.089.
- Modesto, V., Tosato, L., Pilbala, A., Benistati N., Fraccarollo L., Termini D., Manca D., Moramarco T., Sousa R., Riccardi N., Mussel behaviour as a tool to measure the impact of hydrodynamic stressors. Hydrobiologia (2023). https://doi.org/10.1007/s10750-022-05126
- Lazzarin T., Viero D. (2023). Curvature-induced secondary flow in 2D depth-averaged hydro-morphodynamic models: An assessment of different approaches and key factors, Advances in Water Resources, Volume 171, https://doi.org/10.1016/j.advwatres.2022.104355.
- 2022
- Bahmanpouri, F., Eltner, A., Barbetta, S., Bertalan, L., & Moramarco, T. (2022). Estimating the average river cross-section velocity by observing only one surface velocity value and calibrating the entropic parameter. Water Resources Research, 58, 2021WR031821. https://doi.org/10.1029/2021WR031821.
- Bahmanpouri F., Barbetta S., Gualtieri C., Ianniruberto M., Filizola N., Termini D., Moramarco T. (2022) ‘Prediction of river discharges at confluences based on Entropy theory and surface-velocity measurements’, Journal of Hydrology, 127404, ISSN 0022-1694, https://doi.org/10.1016/j.jhydrol.2021.127404.
- Ammari, A., Bahmanpouri, F., Khelfi, M. A., Moramarco, T. (2022). The regionalizing of the entropy parameter over the north Algerian watersheds, a discharge measurement approach for ungauged river sites. Hydrological Science J. https://doi.org/10.1080/02626667.2022.2099744.
- Gonzalez-Ondina J. M., Liu P. L-F., and Fraccarollo L. ‘Entrainment and adaptation processes in the evolution of collisional bedload layers’. European Journal of Mechanics-B/Fluids, Volume 92, March–April 2022, Pages 132-142. https://doi.org/10.1016/j.euromechflu.2021.11.007.
- 2021
- Vyas, J.K., Perumal M., Moramarco T. (2021) Entropy Based River Discharge Estimation Using One-Point Velocity Measurement at 0.6D, Water Resources Research, 10.1029/2021wr029825.
- 2020
- Alimenti F., Bonafoni S., Gallo E., Palazzi V. Vincenti Gatti R., Mezzanotte P., Roselli L., Zito D., Barbetta S., Corradini C., Termini D., Moramarco T. (2020) ‘Non-contact measurement ofriver surface velocity and discharge estimation with a low-cost doppler radar sensor’, IEEE Transactions on Geoscience and Remote Sensing, 10.1109/TGRS.2020.2974185.
- Termini D., Moramarco T. (2020). Entropic model applications to identify cross-sectional flow effect on velocity distribution in a large amplitude meandering channel. Advances in Water Resources.Volume 143, September 2020, 1036.
- Vyas, J.K., Perumal M., Moramarco T. (2020) Discharge Estimation Using Tsallis and Shannon Entropy Theory in Natural Channels.Water 12(6), 1786; https://doi.org/10.3390/w12061786 .
- Abdolvandi A.F., Ziaei A.L. Singh V.P. and Moramarco T. (2020). New Approach to Computing Mean Velocity and Discharge. Hydrological Sciences Journal, 66(12) 10.1080/02626667.2020.1859115.
Contacts
Principal Investigator
Tommaso Moramarco
t.moramarco@irpi.cnr.it
Phone: 0039-0755014402
Unit 2 – UNIPD contact person
Daniele Viero
daniele.viero@unipd.it
Unit 4 – UNIPA contact person
Donatella Termini
donatella.termini@unipa.it
Unit 1 – CNR contact person
Silvia Barbetta
s.barbetta@irpi.cnr.it
Phone: 0039-0755014403
Unit 3 – UNIPG contact person
Federico Alimenti
federico.alimenti@unipg.it
Unit 5 – UNITN contact person
Luigi Fraccarollo
luigi.fraccarollo@unitn.it